
Reason to trust
How Our News is Made
Strict editorial policy that focuses on accuracy, relevance, and impartiality
Ad discliamer
Morbi pretium leo et nisl aliquam mollis. Quisque arcu lorem, ultricies quis pellentesque nec, ullamcorper eu odio.
Ethereum is showing positive signs and it broke the $205 resistance against the US Dollar. ETH price could rally significantly if there is a clear break above the $210 resistance.
- Ethereum gained traction and managed to climb above the $205 level and the 100 hourly SMA.
- The price is still struggling to clear the main $210 resistance zone.
- There is a key bearish trend line forming with resistance near $209 on the hourly chart of ETH/USD (data feed via Kraken).
- The pair could either rally above $210 or it might start a fresh decrease towards $200.
Ethereum Price Approaching Key Resistance
Ethereum price started a decent increase from the $196 swing low. ETH price managed to gain traction and climbed above the $204 and $205 resistance levels.
There was also a close above the $205 level and the 100 hourly simple moving average. During the rise, there is a key bearish trend line forming with resistance near $209 on the hourly chart of ETH/USD.
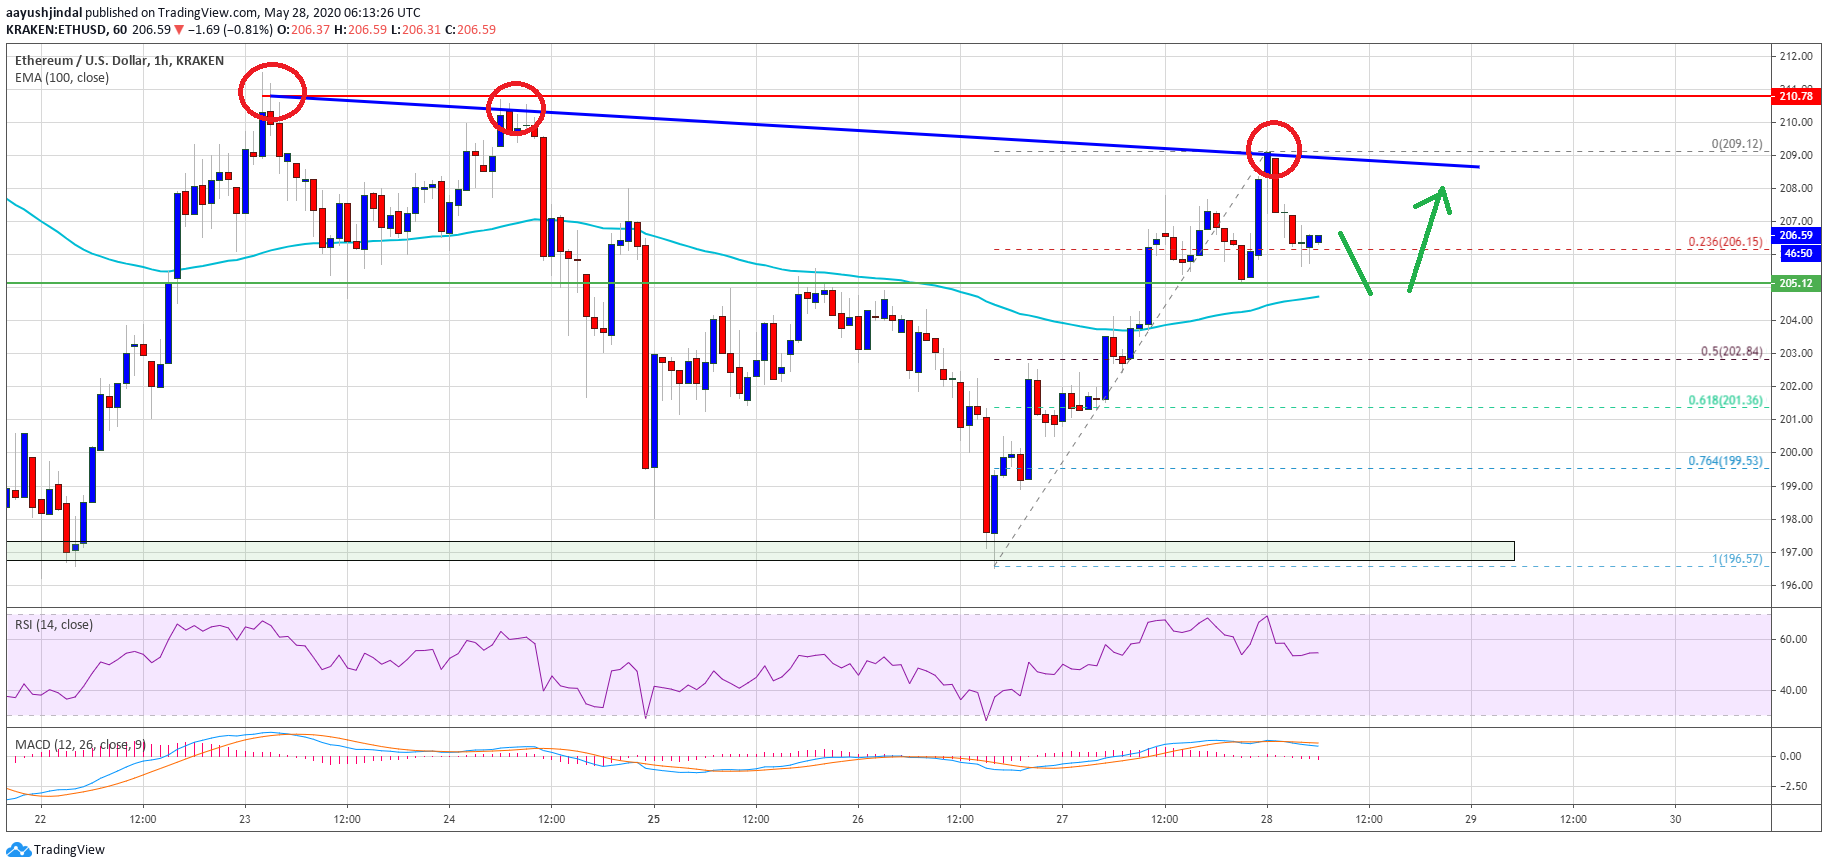
However, the price is still struggling to clear the $210 resistance zone. A high is formed near $209 and the price is currently correcting lower. It is trading near the 23.6% Fib retracement level of the recent rise from the $196 swing low to $209 high.
The first key support on the downside is near the $205 level and the 100 hourly simple moving average. The next major support is seen near the $202 level. It is close to the 50% Fib retracement level of the recent rise from the $196 swing low to $209 high.
On the upside, the price is likely to continue higher if it clears the $210 resistance zone. The next major hurdle is seen near the $220 level, above which it could revisit $230.
Another Rejection?
If Ethereum continues to struggle near the $210 level, there are chances of another bearish push below $202. If there are more losses, there are chances of another drop towards the $198 and $196 support levels.
A successful close below the $198 support zone, the bears are likely to take control and they might aim a test of the $192 support zone in the coming sessions.
Technical Indicators
Hourly MACD – The MACD for ETH/USD is losing momentum in the bullish zone.
Hourly RSI – The RSI for ETH/USD is now well above the 50 level, with a positive angle.
Major Support Level – $205
Major Resistance Level – $210
Take advantage of the trading opportunities with Plus500
Risk disclaimer: 76.4% of retail CFD accounts lose money.


