
Reason to trust
How Our News is Made
Strict editorial policy that focuses on accuracy, relevance, and impartiality
Ad discliamer
Morbi pretium leo et nisl aliquam mollis. Quisque arcu lorem, ultricies quis pellentesque nec, ullamcorper eu odio.
Ethereum is struggling to break the $205 and $210 resistance levels against the US Dollar. ETH price is currently declining and it remains at a risk of a larger decline below $200.
- Ethereum is facing a strong resistance near the $204 and $205 levels.
- The price might continue towards the $192 support if it fails to stay above $200.
- There is a key contracting triangle forming with resistance near $204 on the hourly chart of ETH/USD (data feed via Kraken).
- The pair must climb above $205 and $210 to decrease chances of a larger decline in the near term.
Ethereum Price Could Extend Its Decline
Ethereum price found support near the $198 level after a sharp decline from the $210 resistance. ETH price started a short-term upside correction from $198 and managed to settle above $200.
There was a break above the 23.6% Fib retracement level of the downward move from the $210 high to $198 low. However, ether price seems to be facing a strong resistance near the $205 level and the 100 hourly simple moving average.
There is also a key contracting triangle forming with resistance near $204 on the hourly chart of ETH/USD. The triangle resistance is close to the 50% Fib retracement level of the downward move from the $210 high to $198 low.
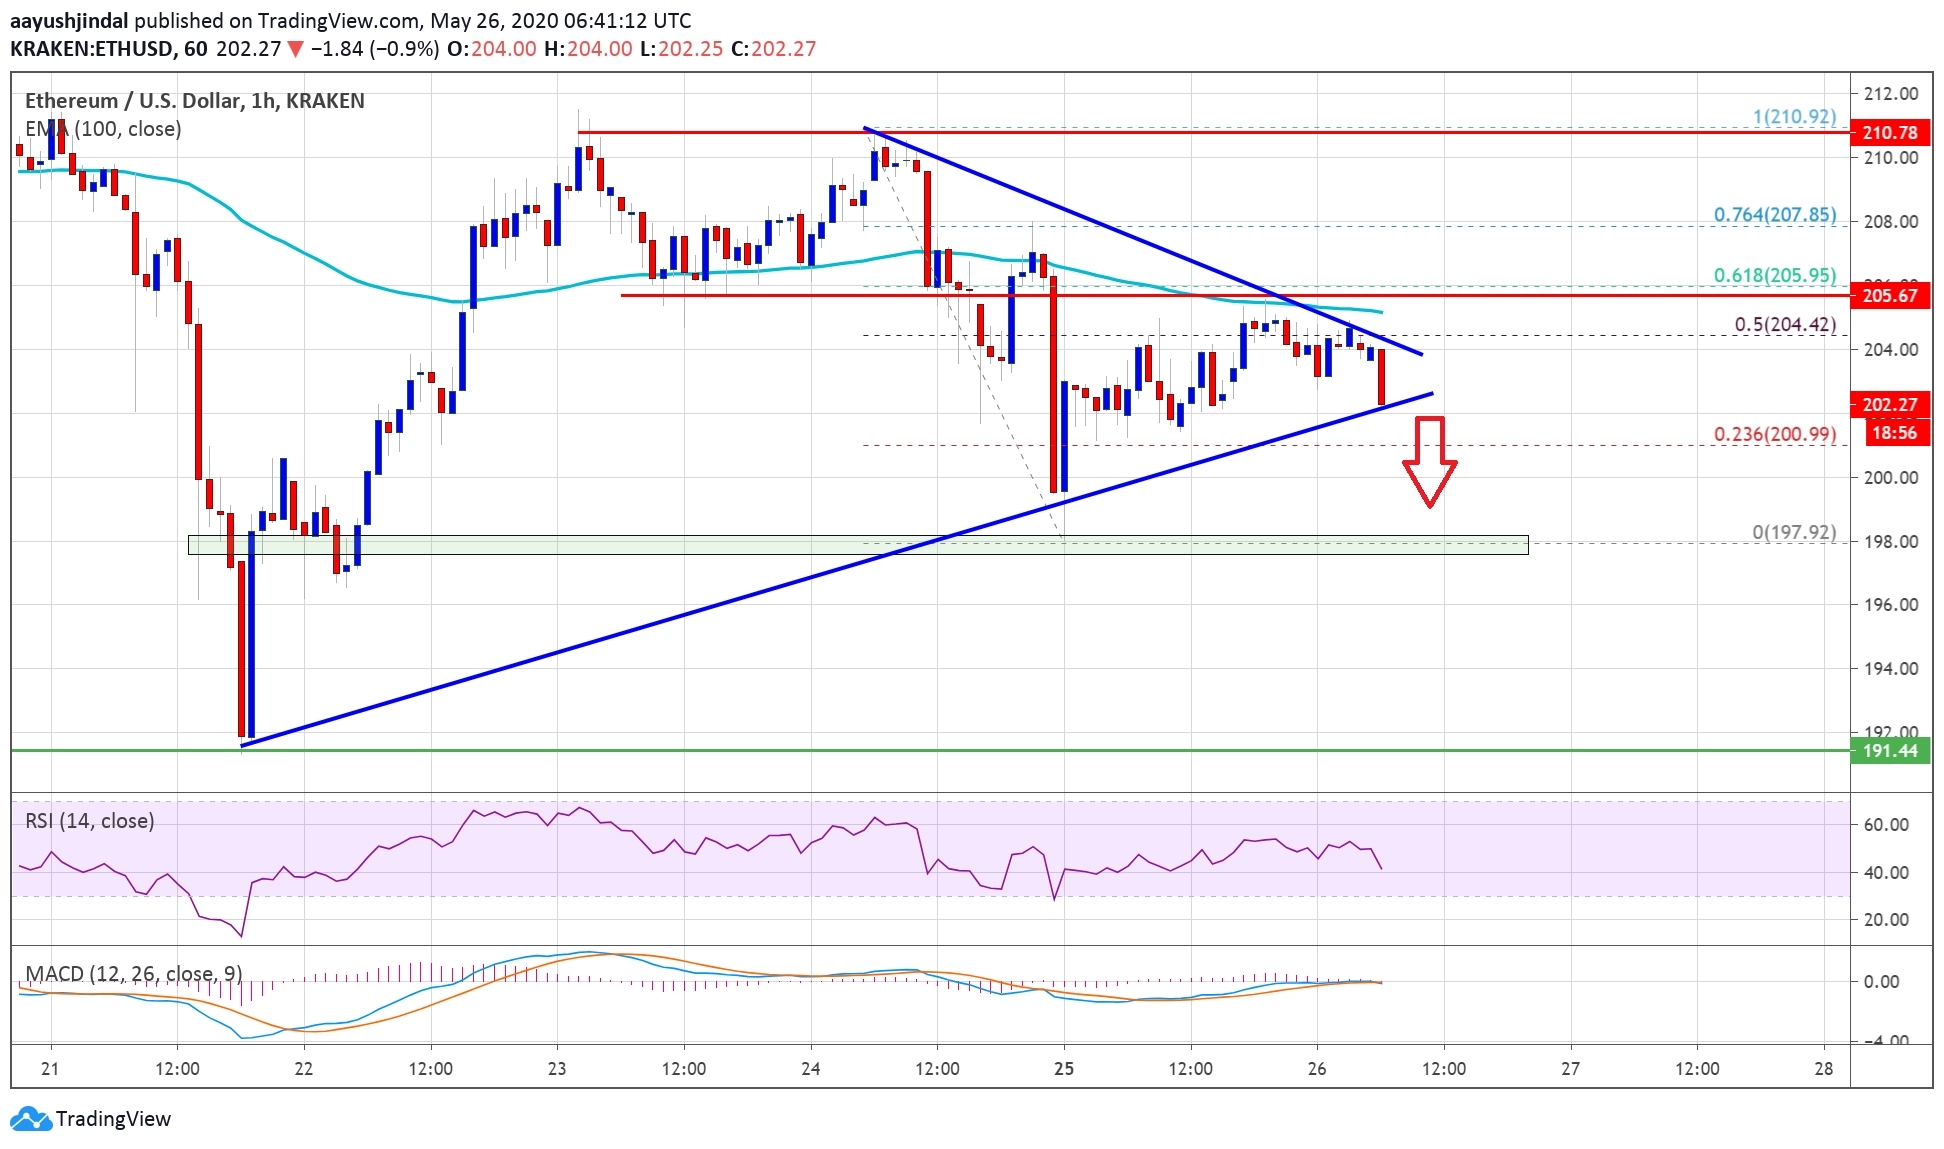
A successful break above the triangle resistance and a follow up move above $205 is needed for a sustained upward move. The main resistance is now near the $210 level.
If the price climbs above the $210 resistance, it could decrease bearish pressure and increase chances of a decent rise towards the $220 and $225 levels in the near term.
Bearish Break
If Ethereum fails to recover above the $205 and $210 resistance levels, there might be a fresh decrease. An initial support is near the triangle lower trend line at $202.
The first key support is near the $200 level, below which the price is likely to continue lower towards $198 and $195. The main uptrend support is near the $192 level. If the bears push the price below the $192 support, it could spark a sharp decline towards the $180 level.
Technical Indicators
Hourly MACD – The MACD for ETH/USD is slowly gaining pace in the bearish zone.
Hourly RSI – The RSI for ETH/USD is now declining and it is now well below the 50 level.
Major Support Level – $200
Major Resistance Level – $205
Take advantage of the trading opportunities with Plus500
Risk disclaimer: 76.4% of retail CFD accounts lose money.


