
Reason to trust
How Our News is Made
Strict editorial policy that focuses on accuracy, relevance, and impartiality
Ad discliamer
Morbi pretium leo et nisl aliquam mollis. Quisque arcu lorem, ultricies quis pellentesque nec, ullamcorper eu odio.
Bitcoin failed to recover above the $9,500 resistance and declined sharply against the US Dollar. BTC price is now trading below key supports, suggesting more downsides towards $8,200 or $8,000.
- Bitcoin is down more than 4% and it is now trading well below the $9,000 level.
- The price traded as low as $8,642 and it is currently well below the 100 hourly simple moving average.
- There was a break below a key bullish trend line with support at $9,200 on the hourly chart of the BTC/USD pair (data feed from Kraken).
- The pair is likely to continue lower towards $8,200 and $8,000 in the coming days.
Bitcoin Dives 4%
Bitcoin price failed to recover above $9,400 and $9,500 against the US Dollar. As a result, BTC price started a nasty decline and broke many key supports near $9,200 and $9,000 (as discussed in the weekly analysis).
The recent decline was initiated after there was a break below a key bullish trend line with support at $9,200 on the hourly chart of the BTC/USD pair. The pair even broke the last swing low near the $8,800 support.
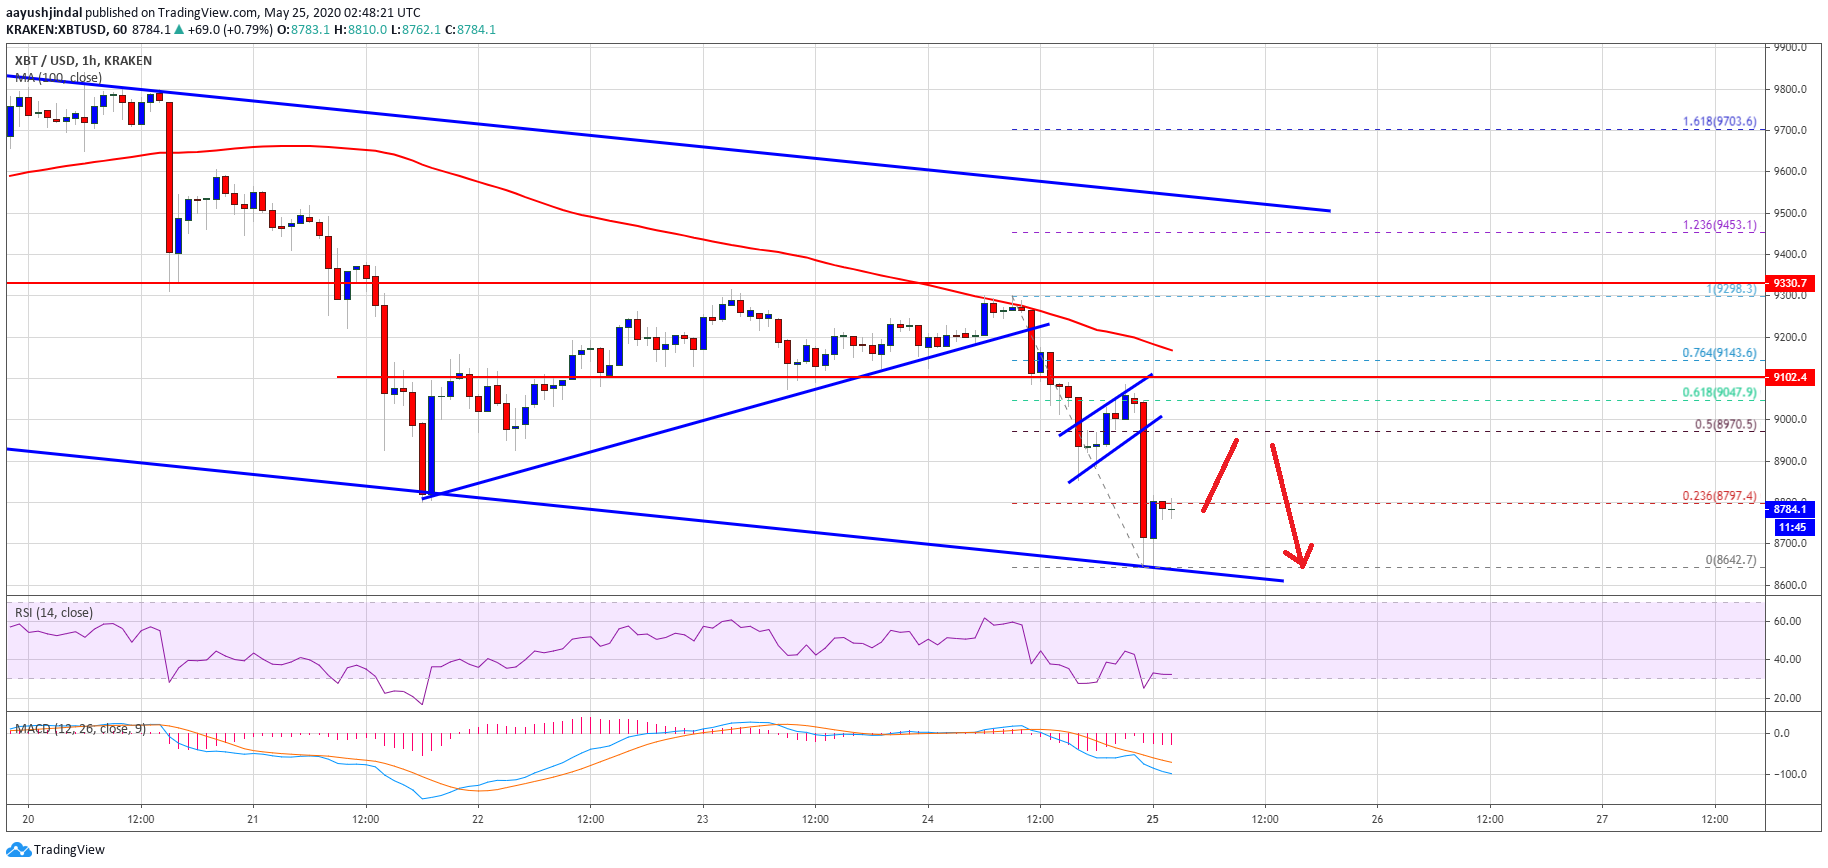
A new weekly low is formed near $8,642 and the price is currently correcting higher. An initial resistance is near the $8,800 level. It is close to the 23.6% Fib retracement level of the recent decline from the $9,298 high to $8,642 low.
The first major resistance is near the $9,000 level (the recent breakdown zone). It is also near the 50% Fib retracement level of the recent decline from the $9,298 high to $8,642 low.
The main resistance is near the $9,150 level and the 100 hourly simple moving average. To move into a positive zone, the price must recover above the $9,000 level and gain bullish momentum above the $9,150 pivot level.
More Downsides in BTC?
The current price action suggests that bitcoin price might struggle to continue higher above $9,150. On the downside, the main support is near the $8,600 level, which is close to the declining channel lower trend line as discussed in yesterday’s weekly forecast.
If there is a break below the $8,642 low and the $8,600 support, there are chances of more losses. The next key supports are near $8,380, $8,200 and finally $8,000.
Technical indicators:
Hourly MACD – The MACD is currently showing a lot of bearish signs.
Hourly RSI (Relative Strength Index) – The RSI for BTC/USD is now well below the 40 level.
Major Support Levels – $8,600 followed by $8,380.
Major Resistance Levels – $9,000, $9,150 and $9,200.


