
Reason to trust
How Our News is Made
Strict editorial policy that focuses on accuracy, relevance, and impartiality
Ad discliamer
Morbi pretium leo et nisl aliquam mollis. Quisque arcu lorem, ultricies quis pellentesque nec, ullamcorper eu odio.
Ethereum is trading nicely above the $192 and $200 support levels against the US Dollar. ETH price could start a strong rally if it clears the $210 and $215 resistance levels.
- ETH price is showing positive signs above $200 pivot level against the US Dollar.
- A strong support base is forming above $205 and the 100 simple moving average (4-hours).
- There is a crucial contracting triangle forming with resistance near $210 on the 4-hours chart of ETH/USD (data feed via Kraken).
- The pair could start a strong rally if it breaks $210 and $215 in the near term.
Ethereum Price Eyeing Another Rally
This past week, Ethereum failed to clear the key $215 resistance area against the US Dollar. ETH price started a nasty decline and broke the key $202 and $200 support levels.
The price even spiked below the $195 level and the 100 simple moving average (4-hours). Ether tested a major support zone at $192, where the bulls took a strong stand.
A low is formed near $191 and the price started another upward move. It surpassed the $200 and $202 resistance levels. Besides, there was a break above the 50% Fib retracement level of the main drop from the $215 swing high to $191 swing low.
Ethereum is now trading above the $205 level and the 100 simple moving average (4-hours). It is facing a major resistance near the $210 level. There is also a crucial contracting triangle forming with resistance near $210 on the 4-hours chart of ETH/USD.
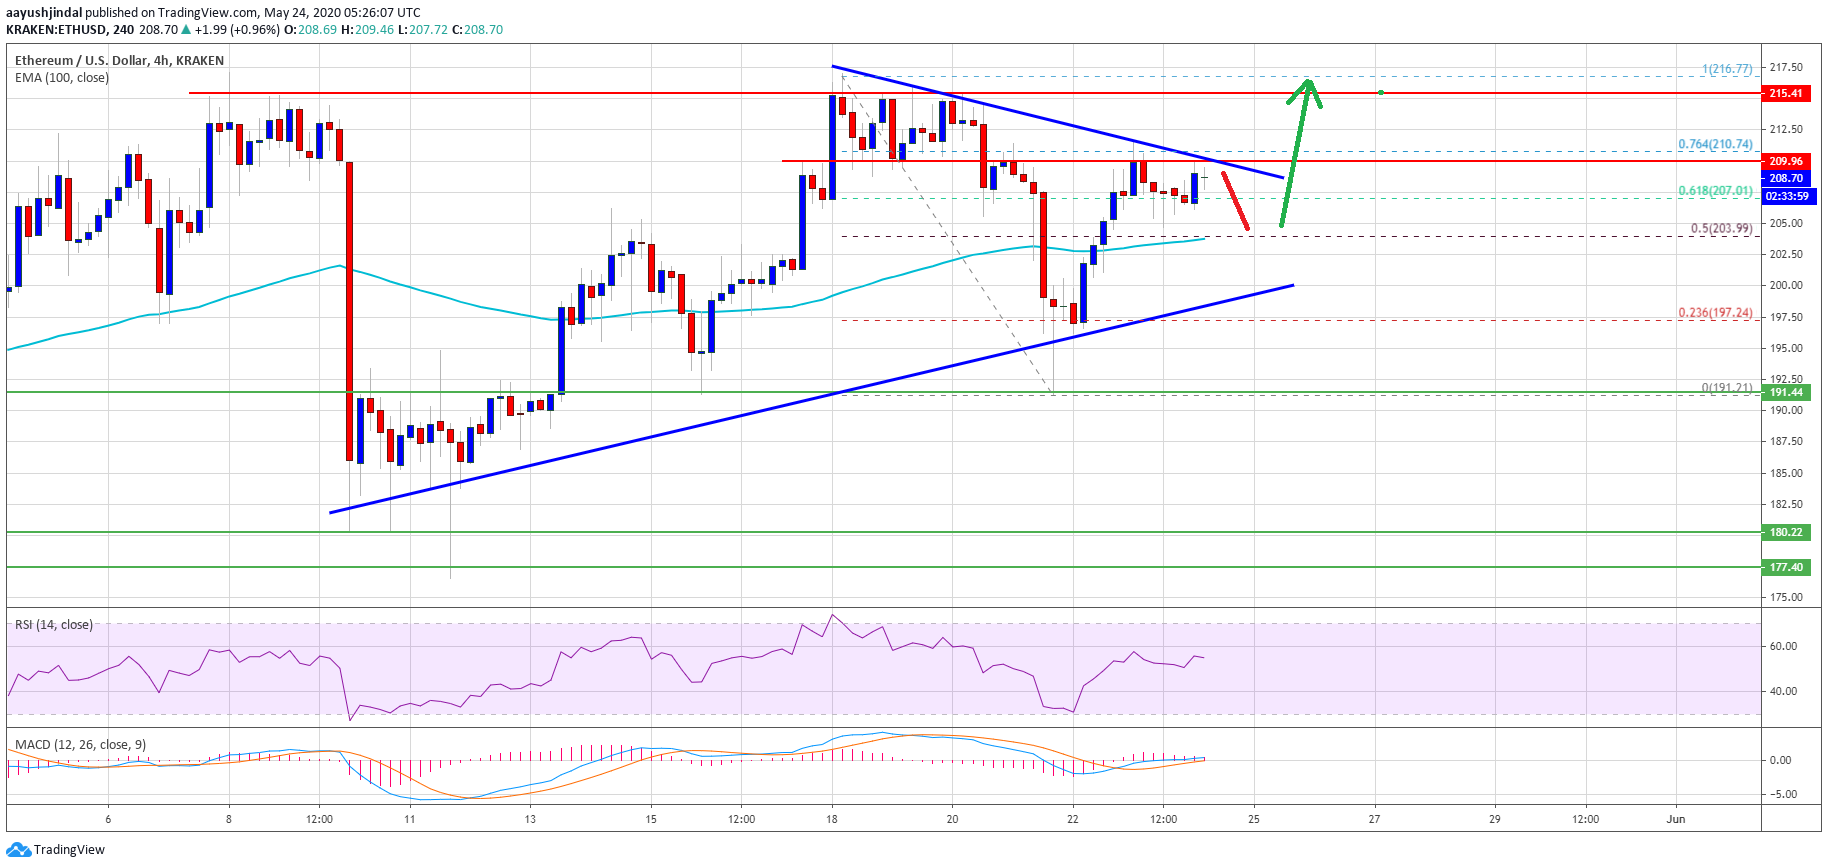
The triangle trend line coincides with the 76.4% Fib retracement level of the main drop from the $215 swing high to $191 swing low. If the bulls are able to clear the triangle resistance at $210, it could even surpass the main $215 resistance level.
A successful break above the $215 resistance zone may perhaps start a steady rise towards the $220 and $230 resistance levels. Any further gains might call for a test of the $250 resistance zone in the near term.
Bearish Break?
If Ethereum fails to continue above the $210 and $215 resistance levels, there are chances of anther drop in the near term. An initial support is near the $203 level and the 100 simple moving average (4-hours).
The main support is near the $200 level and the triangle support, below which the price is likely to accelerate lower towards the $192 support zone.
Technical Indicators
4 hours MACD – The MACD for ETH/USD is slowly losing pace in the bullish zone.
4 hours RSI – The RSI for ETH/USD is currently well above the 50 level.
Major Support Level – $200
Major Resistance Level – $210
Take advantage of the trading opportunities with Plus500
Risk disclaimer: 76.4% of retail CFD accounts lose money.


