
Reason to trust
How Our News is Made
Strict editorial policy that focuses on accuracy, relevance, and impartiality
Ad discliamer
Morbi pretium leo et nisl aliquam mollis. Quisque arcu lorem, ultricies quis pellentesque nec, ullamcorper eu odio.
Bitcoin started a strong decline after it broke the key $9,500 support against the US Dollar. BTC price is currently correcting higher from the $8,794 low, but upsides are likely to remain capped.
- Bitcoin is down more than 5% and it broke many key supports near $9,500 and $9,150.
- The price is now trading well below the $9,250 pivot level and the 100 hourly simple moving average.
- There is a key connecting bearish trend line forming with resistance near $9,220 on the hourly chart of the BTC/USD pair (data feed from Kraken).
- The pair is likely to face a strong selling interest near the $9,220, $9,250 and $9,300 levels.
Bitcoin Turns Red
Bitcoin price started a strong decline after it failed to climb above $9,800 against the US Dollar. BTC price broke many supports near $9,540 and $9,500 to enter a bearish zone (as discussed yesterday).
There was a sharp slide below the $9,250 and $9,150 support levels. It even dived below $9,000 and settled well below the 100 hourly simple moving average. It traded to a new weekly low at $8,794 before starting an upside correction.
Bitcoin recovered above the $9,000 resistance level. It also managed to recover above the 23.6% Fib retracement level of the recent slide from the $9,842 high to $8,794 low.
On the upside, there are many hurdles forming near the $9,220, $9,250 and $9,300 levels. There is also a key connecting bearish trend line forming with resistance near $9,220 on the hourly chart of the BTC/USD pair.
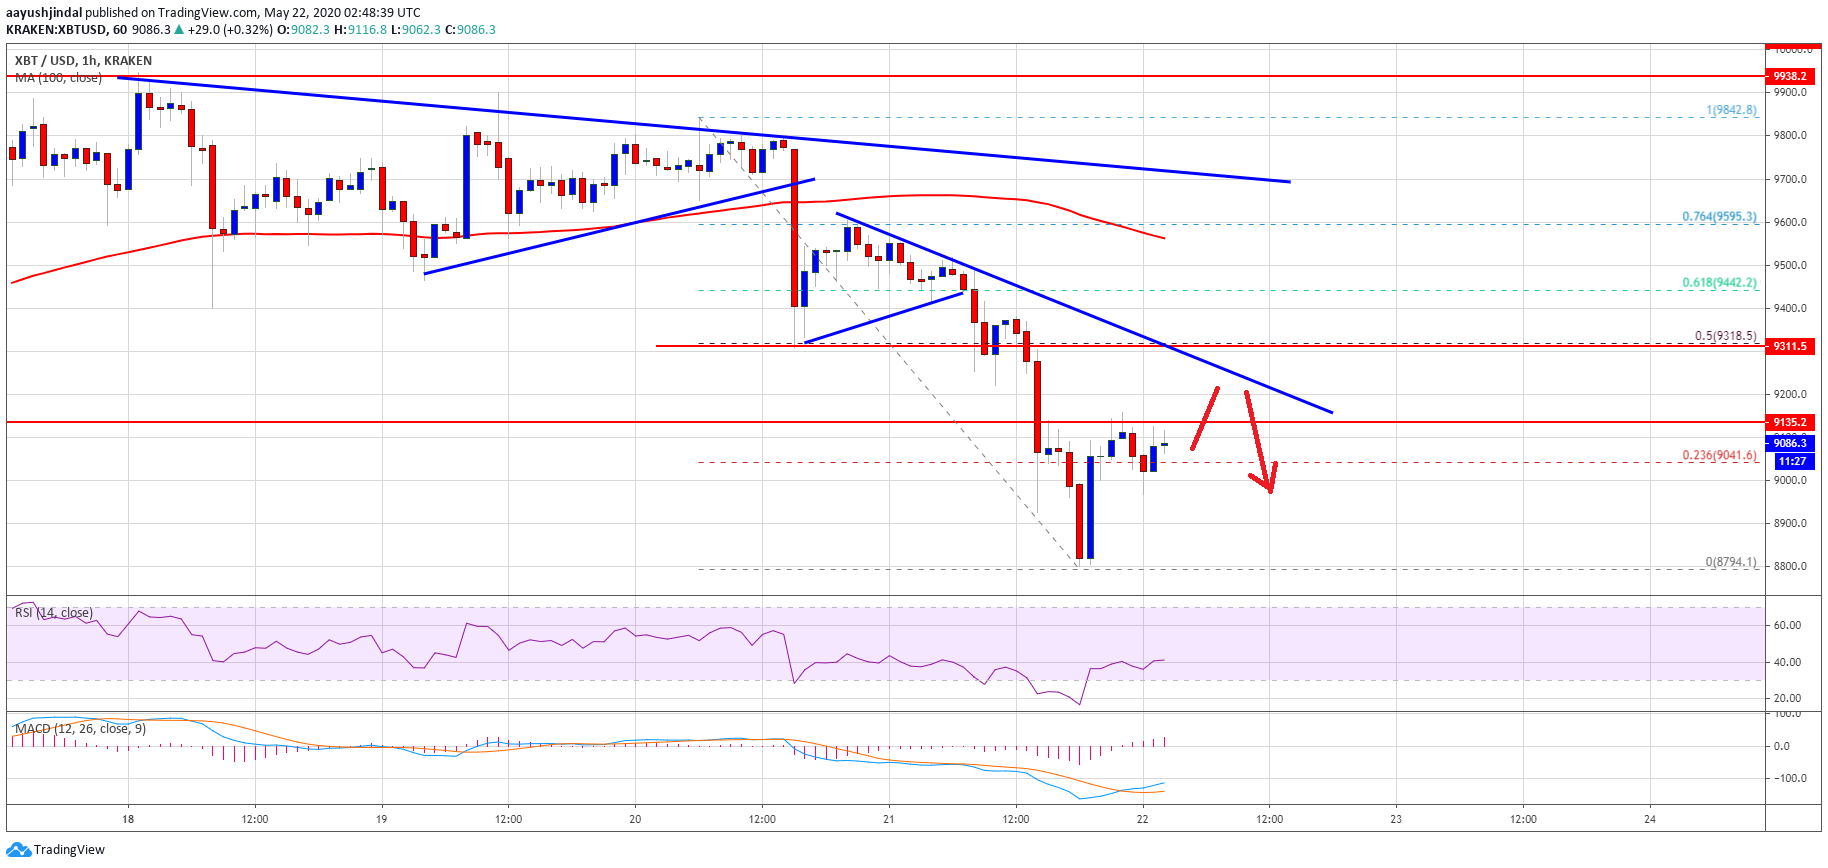
The trend line is close to the 50% Fib retracement level of the recent slide from the $9,842 high to $8,794 low. Therefore, the price is likely to face a strong selling interest near the $9,220, $9,250 and $9,300 levels in the near term.
BTC’s Bearish Extension
If bitcoin fails to correct above the $9,150 and $9,250 resistance levels, it is likely to continue lower. An initial support on the downside is near the $9,000 level.
A daily close below the $9,000 level might start another bearish wave. The next key support is near the $8,800 level, below which the price is likely to dive towards the $8,500 support zone. Any further losses may perhaps lead the price towards $8,200.
Technical indicators:
Hourly MACD – The MACD is currently in the bullish zone, but it could turn bearish again.
Hourly RSI (Relative Strength Index) – The RSI for BTC/USD is currently recovering towards the 45 level.
Major Support Levels – $9,000 followed by $8,800.
Major Resistance Levels – $9,130, $9,250 and $9,300.


