
Reason to trust
How Our News is Made
Strict editorial policy that focuses on accuracy, relevance, and impartiality
Ad discliamer
Morbi pretium leo et nisl aliquam mollis. Quisque arcu lorem, ultricies quis pellentesque nec, ullamcorper eu odio.
Bitcoin failed to climb above the $9,950 and $10,000 resistance levels against the US Dollar. BTC price is currently plunging and it is now vulnerable to more losses below $9,400.
- Bitcoin is down more than 3% from the weekly high and it is now showing bearish signs.
- The price is trading well below the $9,600 level and the 100 hourly simple moving average.
- There was a break below a major contracting triangle with support near $9,600 on the hourly chart of the BTC/USD pair (data feed from Kraken).
- The pair remains at a risk of more losses below the $9,400 and $9,250 levels.
Bitcoin Showing Bearish Signs
Bitcoin price started a bearish wave after it failed to continue above the $9,950 and $10,000 resistance levels against the US Dollar. BTC price is down more than 3% from the weekly high and it broke the $9,540 support zone.
The recent decline was such that the price even broke the $9,400 level and settled below the 100 hourly simple moving average. More importantly, there was a break below a major contracting triangle with support near $9,600 on the hourly chart of the BTC/USD pair.
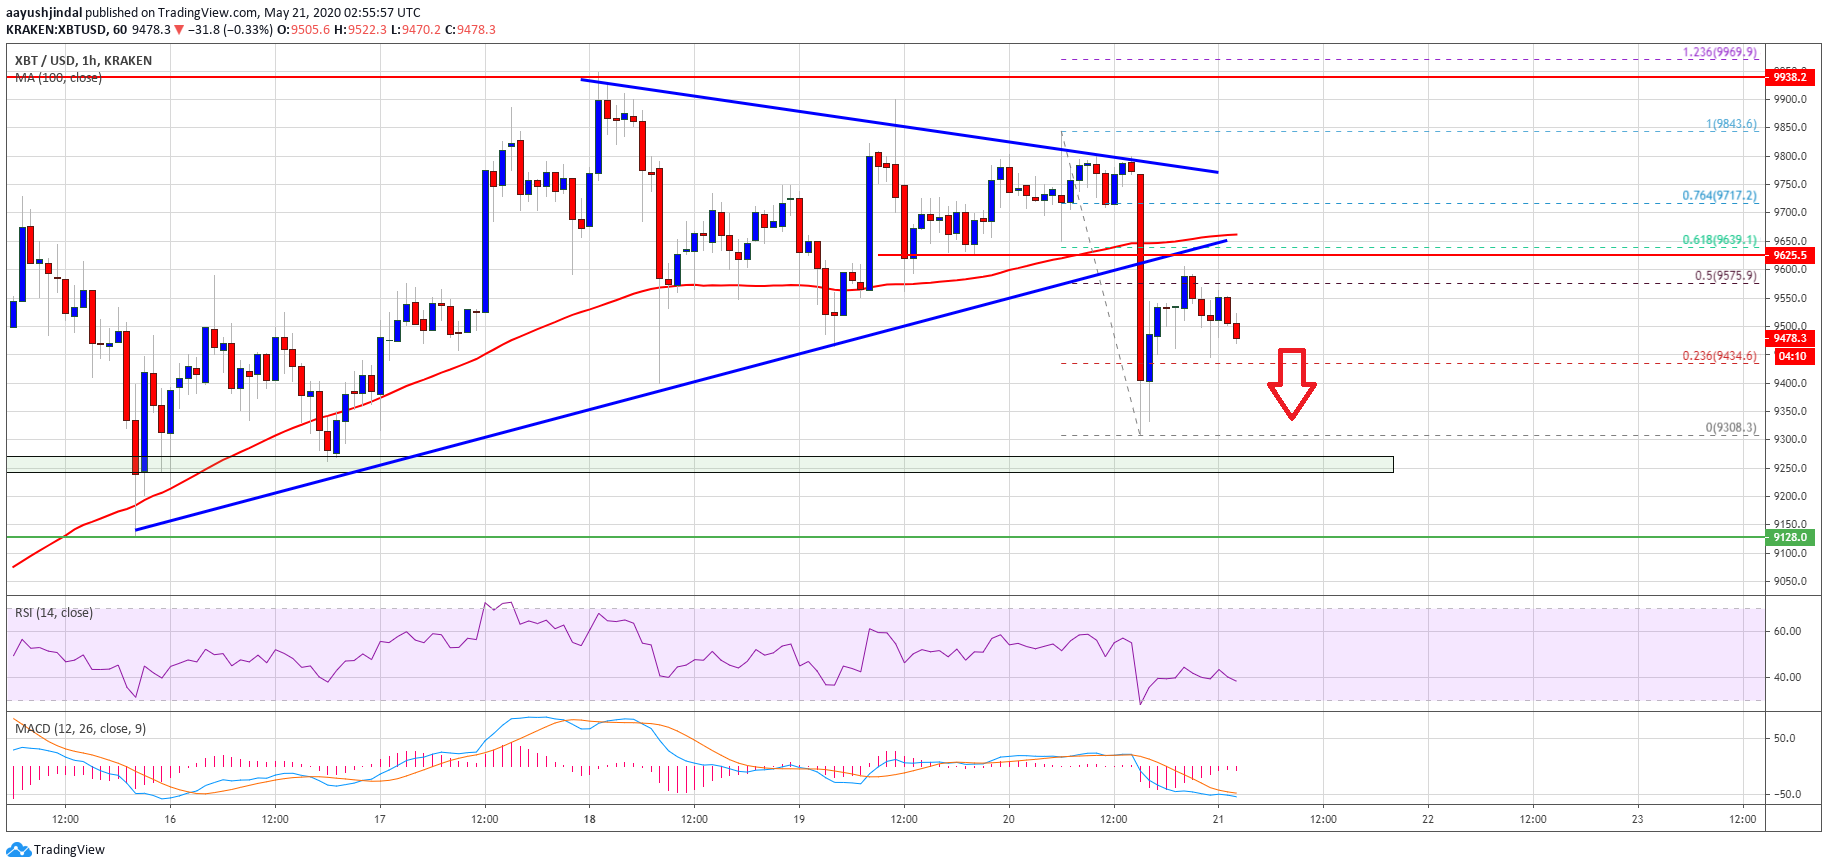
A low is formed near $9,308 and bitcoin price is currently correcting higher. It tested the 50% Fib retracement level of the recent decline from the $9,843 high to $9,309 low.
It seems like the previous supports near $9,540 and $9,600 are now acting as hurdles. The first major hurdles is near the $9,640 level and the 100 hourly simple moving average. The 61.8% Fib retracement level of the recent decline from the $9,843 high to $9,309 low is also at $9,639.
To avoid more losses, BTC price must move back above the $9,540 and $9,640 resistance levels. The next key hurdles on the upside remain $9,950 and $10,000.
More Losses?
If bitcoin fails to recover above the $9,540 and $9,640 resistance levels, there are chances of more losses in the near term. An immediate support is near the $9,400 level.
The main support is near the $9,250 zone (the last key pivot zone). If the bulls fail to defend the $9,250 support level, the price could continue to move down towards the $9,120 and $9,000 levels in the near term.
Technical indicators:
Hourly MACD – The MACD is slowly reducing its bearish slope, but there are many negative signs visible.
Hourly RSI (Relative Strength Index) – The RSI for BTC/USD is sliding and it is well below the 50 level.
Major Support Levels – $9,400 followed by $9,250.
Major Resistance Levels – $9,640, $9,800 and $9,950.


