
Reason to trust
How Our News is Made
Strict editorial policy that focuses on accuracy, relevance, and impartiality
Ad discliamer
Morbi pretium leo et nisl aliquam mollis. Quisque arcu lorem, ultricies quis pellentesque nec, ullamcorper eu odio.
Bitcoin is currently consolidating above the $8,500 and $8,250 support levels against the US Dollar. BTC price seems to be setting up for a strong bull run above $9,000 and $9,100.
- Bitcoin is trading in a crucial range above the $8,500 and $8,200 support levels.
- The bulls need to clear the $9,000 and $9,100 hurdles to gain strength.
- There was a break above a connecting bearish trend line with resistance near $8,920 on the hourly chart of the BTC/USD pair (data feed from Kraken).
- The pair must settle above $9,100 to start a fresh bull run in the near term.
Bitcoin Could Surge Above $9,100
In the past few sessions, bitcoin price remained well bid above the $8,500 and $8,250 support levels against the US Dollar. BTC price traded as low as $8,203 and recently started a steady recovery wave.
It surpassed the $8,500 and $8,600 resistance levels. Besides, there was a break above the 23.6% Fib retracement level of the main drop from the $10,020 high to $8,203 low.
The upward move was such that there was a break above a connecting bearish trend line with resistance near $8,920 on the hourly chart of the BTC/USD pair. Bitcoin is now trading above $8,900 and testing the 100 hourly simple moving average.
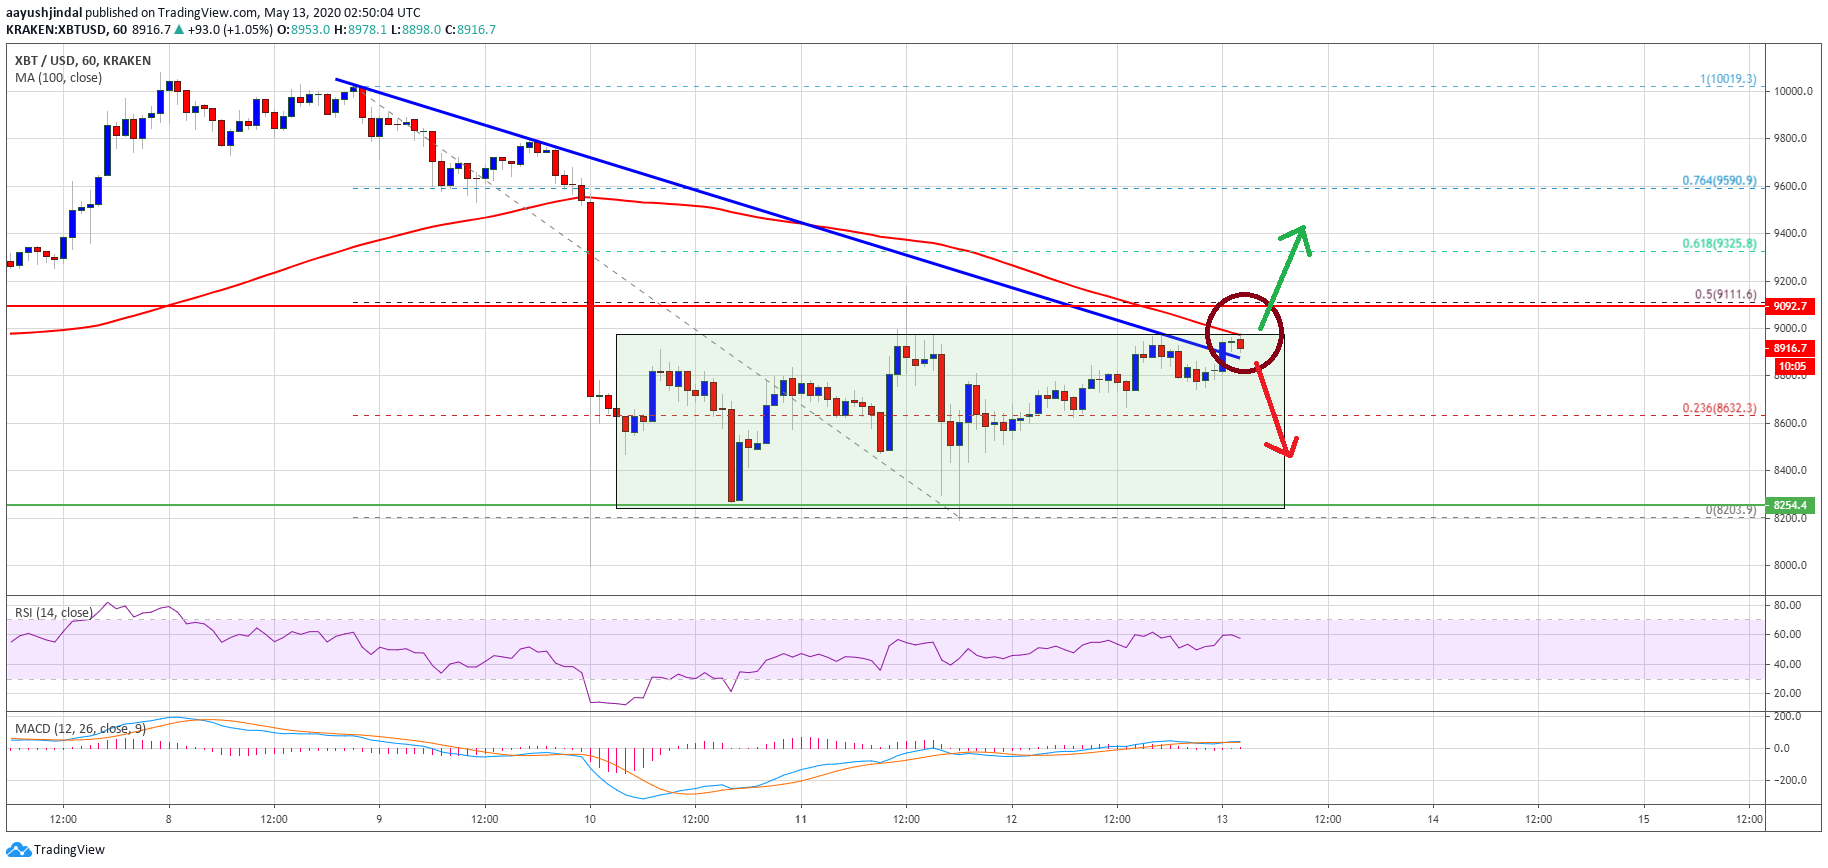
An immediate resistance above the 100 hourly simple moving average is near the $9,100 level. It is close to the 50% Fib retracement level of the main drop from the $10,020 high to $8,203 low.
If BTC breaks the 100 hourly SMA and clears the $9,100 resistance, there could be a strong increase towards the $9,500 level. Any further gains could lead the price towards the $9,800 and $10,000 resistance levels. An intermediate resistance might be near the $9,880 level.
Bearish Reaction
If bitcoin fails to clear the 100 hourly SMA or the $9,100 resistance, it could react to the downside. An initial support is near the $8,800 level.
The first major support is seen near the $8,500 level, below which the bears are likely to aim a test of the lower end of the range at $8,250. Any further losses below $8,250 or $8,200 could open the doors for a sharp decline below $8,000 and $7,800 in the near term.
Technical indicators:
Hourly MACD – The MACD is slowly gaining momentum in the bullish zone.
Hourly RSI (Relative Strength Index) – The RSI for BTC/USD is now well above the 50 level.
Major Support Levels – $8,800 followed by $8,500.
Major Resistance Levels – $9,000, $9,100 and $9,175.
Featured image from unsplash.


