
Reason to trust
How Our News is Made
Strict editorial policy that focuses on accuracy, relevance, and impartiality
Ad discliamer
Morbi pretium leo et nisl aliquam mollis. Quisque arcu lorem, ultricies quis pellentesque nec, ullamcorper eu odio.
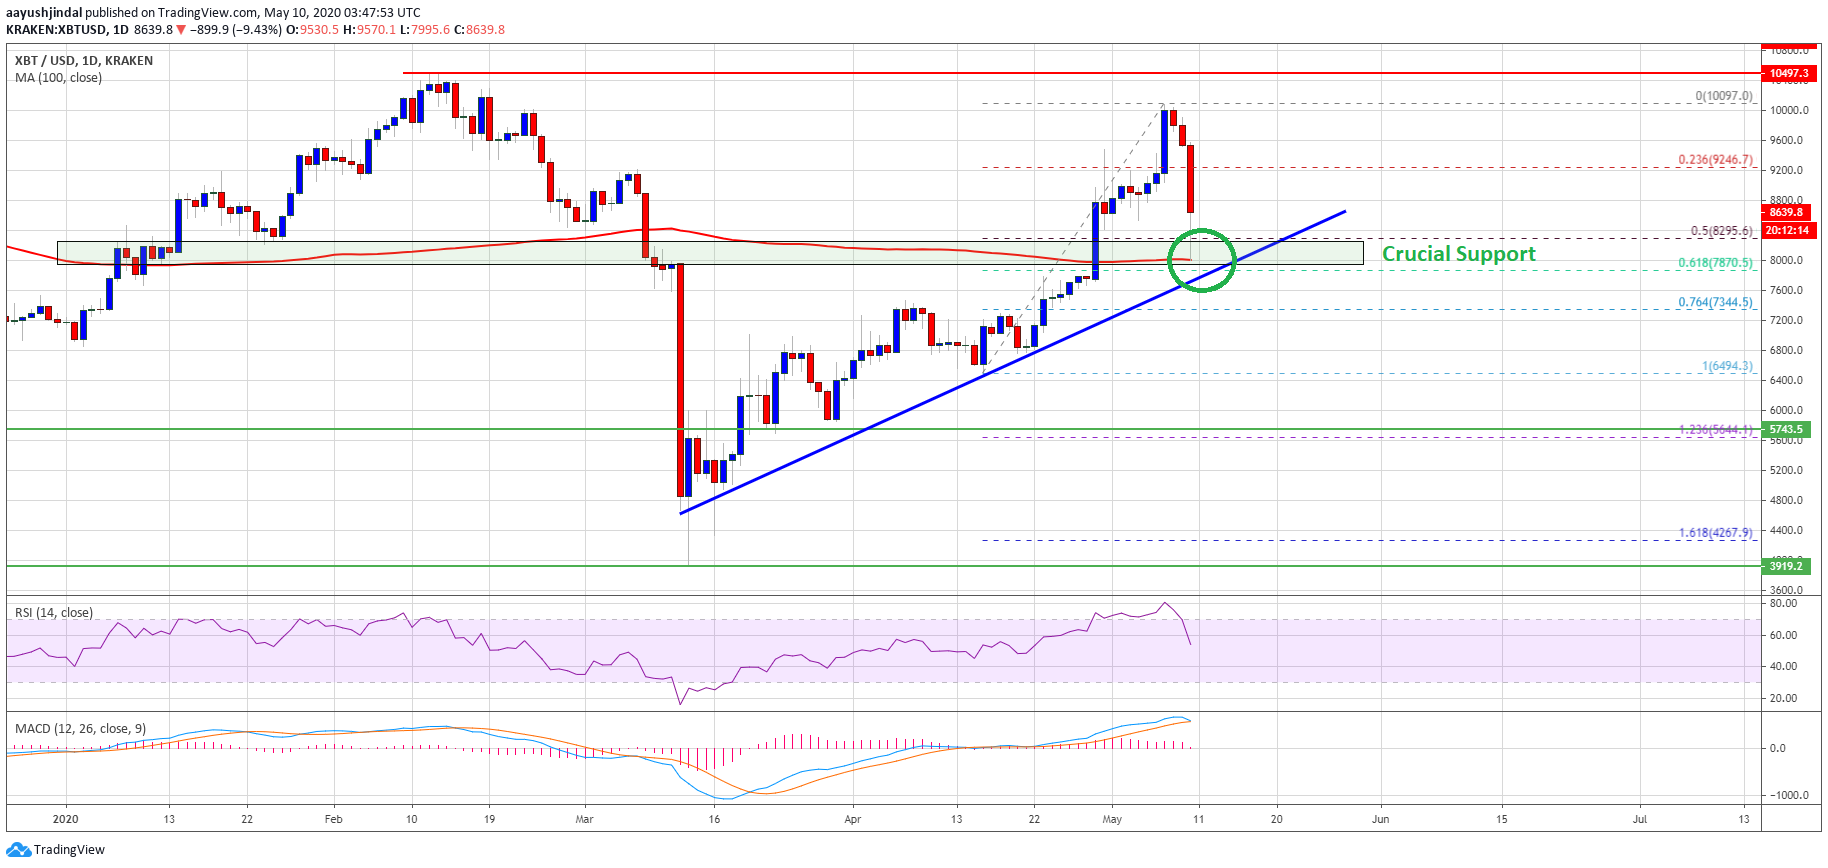
Bitcoin is down more than 10% from the $10,090 high against the US Dollar. BTC found support near the 100-day simple moving average and it could start a fresh increase.
- Bitcoin climbed to a new monthly high at $10,097 before starting a downside correction.
- The recent pre-halving dump found support near the 100-day simple moving average.
- There is a major bullish trend line forming with support near $8,000 on the daily chart of the BTC/USD pair (data feed from Kraken).
- Ethereum and ripple are also down more than 10% and both declined below key supports.
Bitcoin Dives Before Halving
This past week, bitcoin price extended its rally above the $9,200 resistance against the US Dollar. BTC price even broke the $9,500 resistance and settled well above the 100-day simple moving average.
It traded above the $10,000 level and formed a new monthly high at $10,097. It started a strong decline from the $10,097 high and broke many supports near the $9,500 and $9,200 levels.
Bitcoin even declined below the $8,500 support, plus the 50% Fib retracement level of the upward move from the $6,494 low to $10,097 high. However, the price found support near the $8,000 zone and the 100-day simple moving average.
The 61.8% Fib retracement level of the upward move from the $6,494 low to $10,097 high is also acting as a support. There is also a major bullish trend line forming with support near $8,000 on the daily chart of the BTC/USD pair.
If the price fails to stay above the trend line support, $8,000, and the 100-day simple moving average, there are chances of a trend change. In the mentioned case, the price could extend its decline towards the $7,350 and $7,000 levels in the coming days.
Dump and Pump
If the 100-day SMA remains intact, bitcoin price is likely to start a fresh increase above the $8,800 and $9,000 resistance levels. The first major resistance is near the $9,200 level, followed by $9,500.
A clear break above the $9,500 resistance may perhaps open the doors for a fresh push towards the $10,000 level in the near term. Any further gains will most likely call for a strong surge towards the $11,000 and $11,200 levels.
Technical indicators:
Daily MACD – The MACD is slowly losing momentum in the bullish zone.
Daily RSI (Relative Strength Index) – The RSI for BTC/USD declined sharply and it is currently approaching the 50 level.
Major Support Levels – $8,200 followed by $8,000.
Major Resistance Levels – $9,000, $9,500 and $10,000.


