
Reason to trust
How Our News is Made
Strict editorial policy that focuses on accuracy, relevance, and impartiality
Ad discliamer
Morbi pretium leo et nisl aliquam mollis. Quisque arcu lorem, ultricies quis pellentesque nec, ullamcorper eu odio.
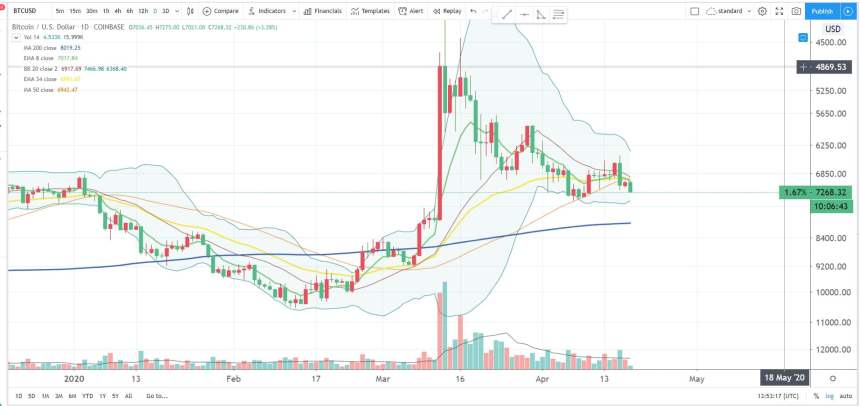
Bitcoin saw a notable overnight rally that allowed it to move as high as $7,300, with this coming about after an extended period of trading sideways within the lower-$7,000 region for the latter part of this past week.
It now appears that bulls are targeting a movement towards $8,000, as resistance could be weakening as bulls begin mustering up further strength.
This also comes as bulls attempt to surmount a historically significant moving average that could prove to be the impetus for BTC’s next major uptrend – should bulls successfully push past it.
Bitcoin Pushes Higher as it Shows Signs of Seeing Further Momentum
At the time of writing, Bitcoin is trading up just over 2% at its current price of $7,230, which marks a slight climb from daily lows of $7,050 that were set during the bout of consolidation seen yesterday.
This climb, although relatively small in dollar-terms, is significant from the standpoint of the crypto moving past its first near-term resistance level at $7,200 – as this is where bulls faced multiple harsh rejections at throughout the past several days.
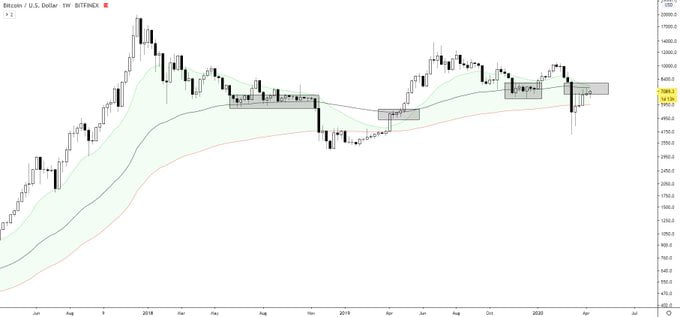
One interesting observation from a popular pseudonymous Twitter analyst is that Bitcoin’s inverse chart seems to paint a highly bullish situation for the crypto, with a target existing at $8,000.
“Bitcoin daily inverse chart makes a compelling case for the upcoming $8000 test,” he noted while pointing to the below chart.
Some traders and investors believe that inverse charts can provide a unique insight into an asset’s technical situation, as they erase bias and help you view the asset with a different perspective.
While looking at the chart the analyst references, it does appear that Bitcoin is poised to move towards its 200-day moving average that exists at roughly $8,000.
BTC’s Reaction to This Key Technical Level Could Spark the Next Major Uptrend
Bitcoin’s potential push to its 200-day moving average also comes as the crypto begins attempting to flip its 89-day ema, which is a historically significant technical level that has determined previous trends.
Another analyst pointed to this level in a recent tweet, explaining that it has been resistance for BTC for 6 weeks now.
“Never underestimate the impact of the 89ema on the greater trend. It has a history of being an incredibly relevant support and resistance level – any bounce/rejection from it has huge consequences on the direction. Currently has been resistance for nearly 6 weeks,” he explained.
Featured image from Unsplash.


