
Reason to trust
How Our News is Made
Strict editorial policy that focuses on accuracy, relevance, and impartiality
Ad discliamer
Morbi pretium leo et nisl aliquam mollis. Quisque arcu lorem, ultricies quis pellentesque nec, ullamcorper eu odio.
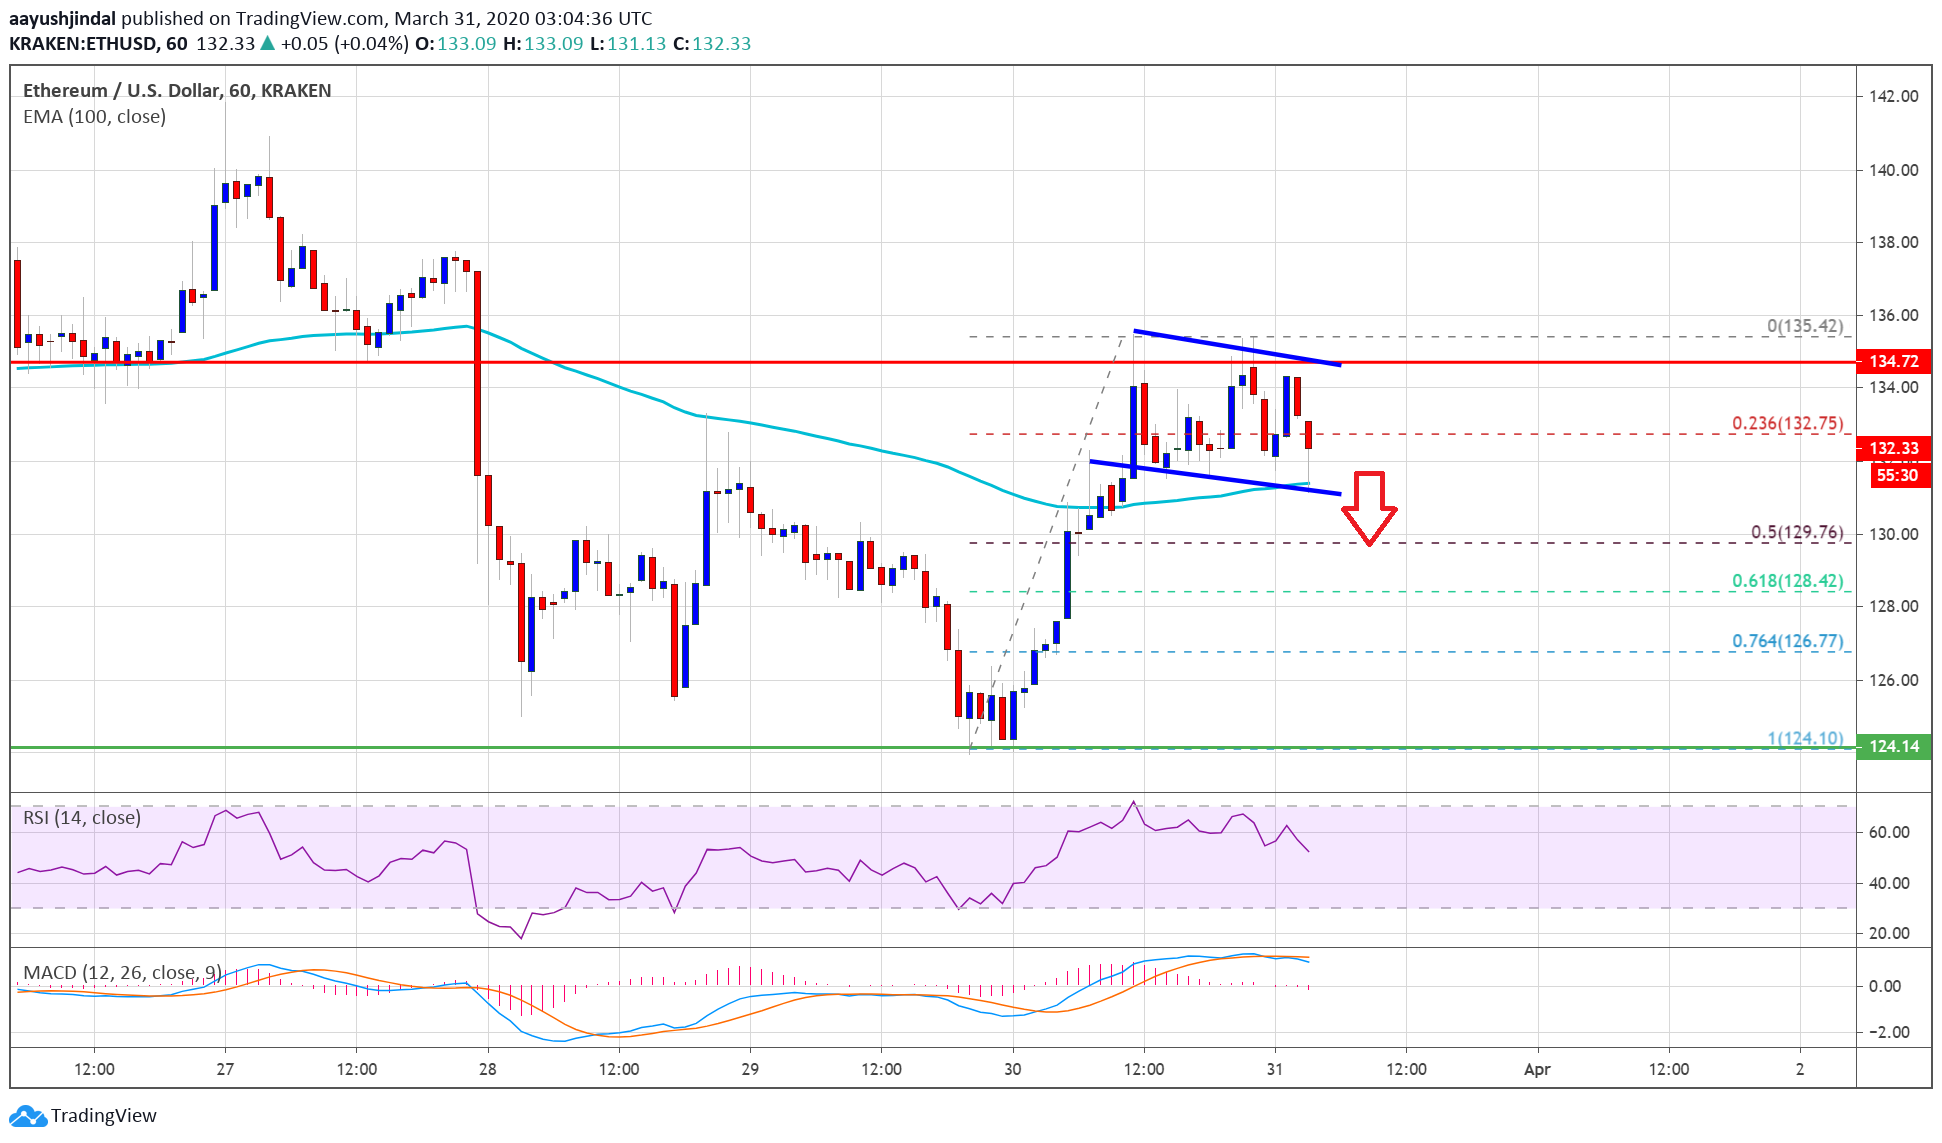
Ethereum is up more than 5% and it broke the $130 resistance area against the US Dollar. However, the main $135 resistance area is still acting as a major hurdle for ETH bulls.
- Ethereum gained traction and it broke the $130 ad $132 resistance levels against the US Dollar.
- The price is currently facing a major resistance near the $135 level (the previous support).
- There is a short term declining channel or a flag pattern forming with resistance near $135 on the hourly chart of ETH/USD (data feed via Kraken).
- The pair could either rally above the $135 barrier or it might restart its downward move.
Ethereum Price Testing Key Resistance
After tagging the $125 support area, Ethereum started a fresh upward move against the US Dollar. ETH price was able to clear the $130 resistance area to move into a positive zone.
The bulls were able to push the price above the $132 level and the 100 hourly simple moving average. The price is up more than 5%, but it is now facing a strong hurdle near the $135 area (the previous support zone).
Ethereum made a couple of attempts to clear the $135 barrier, but it failed. It is currently trading near the 23.6% Fib retracement level of the recent rise from the $124 low to $135 high.
It seems like there is a short term declining channel or a flag pattern forming with resistance near $135 on the hourly chart of ETH/USD. If the bulls are able to clear the $135 resistance area, there are chances of a steady rise towards the $140 and $145 resistance levels.
Any further gains may perhaps start a nice uptrend and the price is likely to test the $155 resistance zone.
Another Drop?
If Ethereum continues to struggle near the $135 resistance, it could decline again. An initial support is near the channel support and the 100 hourly SMA.
A clear break below the $132 level could lead the price towards the $130 support. The 50% Fib retracement level of the recent rise from the $124 low to $135 high is also near the $130 level. Any further losses are likely to accelerate the decline and the price might test the $124 low.
Technical Indicators
Hourly MACD – The MACD for ETH/USD is currently losing momentum in the bullish zone.
Hourly RSI – The RSI for ETH/USD is currently correcting lower and it is approaching the 50 level.
Major Support Level – $130
Major Resistance Level – $135
Take advantage of the trading opportunities with Plus500
Risk disclaimer: 76.4% of retail CFD accounts lose money.


