
Reason to trust
How Our News is Made
Strict editorial policy that focuses on accuracy, relevance, and impartiality
Ad discliamer
Morbi pretium leo et nisl aliquam mollis. Quisque arcu lorem, ultricies quis pellentesque nec, ullamcorper eu odio.
Ripple is up more than 10% and it broke the $0.1550 resistance region against the US Dollar. However, XRP price is lacking strength and pointing a fresh decrease in the near term.
- Ripple price is up more than 10% and it tested the $0.1720 resistance against the US dollar.
- It is now showing a few bearish signs and trading below the $0.1650 level.
- There is a key bullish trend line forming with support near $0.1570 on the hourly chart of the XRP/USD pair (data source from Kraken).
- The price is likely to revisit the $0.1580 and $0.1550 support levels in the near term.
Ripple Price is Correcting Gains
In the past three sessions, ripple gained strength above the $0.1400 and $0.1450 resistance levels. XRP price surged above the $0.1500 resistance level to move into a short term positive zone.
Besides, there was a sharp move above the $0.1650 resistance and the price settled above the 100 hourly simple moving average. A new weekly high was formed near the $0.1720 resistance area.
Ripple is currently correcting lower and trading below the $0.1650 level. There was a break below the 23.6% Fib retracement level of the recent rise from the $0.1407 low to $0.1734 high. On the downside, an initial support is near the $0.1600 level.
The first major support is near the $0.1580 level. There is also a key bullish trend line forming with support near $0.1570 on the hourly chart of the XRP/USD pair.
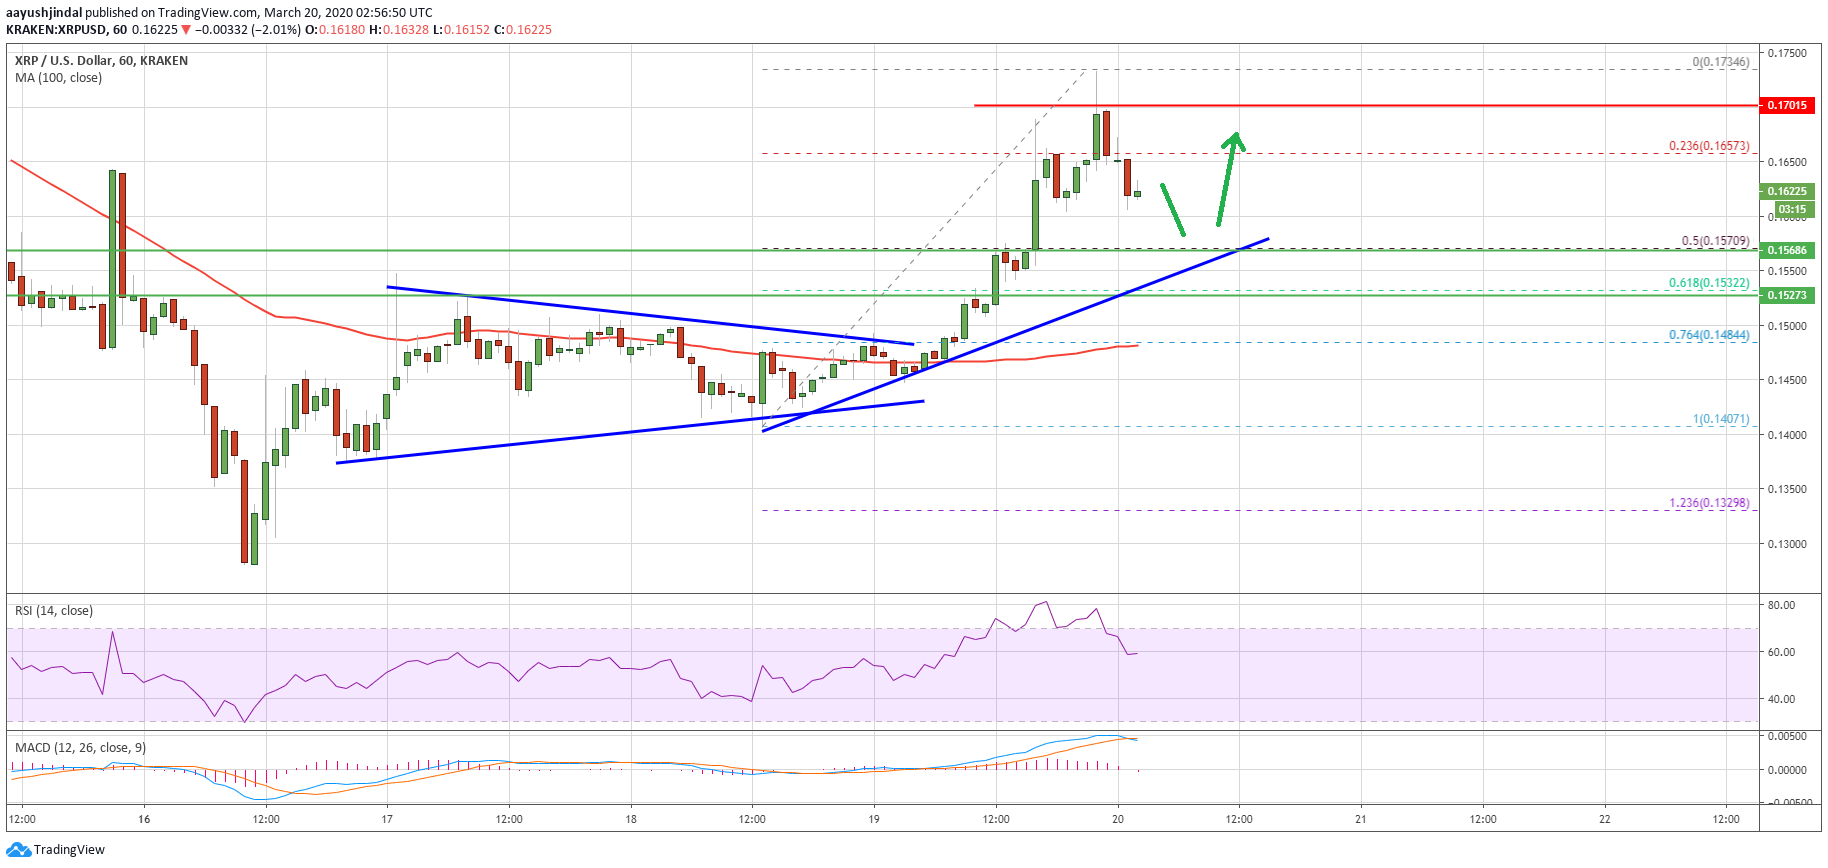
The trend line support is close to the 50% Fib retracement level of the recent rise from the $0.1407 low to $0.1734 high. Therefore, dips towards the $0.1600 and $0.1580 support levels are likely to find a decent buying interest.
Weak Price Action
Despite the recent rally, the current price is weak and suggests ripple might fail to start a fresh increase above the $0.1700 level. As stated, the main support area is now near the $0.1580 level.
If the bulls fail to keep the price above the $0.1580 and $0.1550 levels, there is a risk of a larger decline in the coming sessions. The next major support is near the $0.1450 level. Conversely, the bulls are likely to lead the price above the $0.1720 and $0.1780 levels.
Technical Indicators
Hourly MACD – The MACD for XRP/USD is slowly moving back into the bearish zone.
Hourly RSI (Relative Strength Index) – The RSI for XRP/USD is currently correcting lower towards the 50 level.
Major Support Levels – $0.1600, $0.1580 and $0.1570.
Major Resistance Levels – $0.1650, $0.1700 and $0.1720.


