
Reason to trust
How Our News is Made
Strict editorial policy that focuses on accuracy, relevance, and impartiality
Ad discliamer
Morbi pretium leo et nisl aliquam mollis. Quisque arcu lorem, ultricies quis pellentesque nec, ullamcorper eu odio.
Ripple is showing a lot of bearish signs below the $0.2050 pivot area against the US Dollar. XRP price is vulnerable to a massive decline below the $0.2000 and $0.1980 support levels.
- Ripple price is declining and it is trading well below the $0.2100 resistance against the US dollar.
- The price is likely to dive below the $0.2000 and $0.1980 support levels in the near term.
- There is a major declining channel forming with resistance near $0.2070 on the hourly chart of the XRP/USD pair (data source from Kraken).
- The price could bounce if the bulls manages to protect $0.1980 once again.
Ripple Price Likely To Slide Further
In the past few days, ripple bears made a few attempts to push the price below the $0.2000 and $0.1980 support levels, but they failed. XRP price formed a high near the $0.2099 level and recently started a fresh decline.
There was a break below the $0.2050 pivot level. The price even declined below the 50% Fib retracement level of the recent rise from the $0.1991 low to $0.2099 high.
It seems like ripple bears are in control and they are attempting a bearish break below the $0.2000 and $0.1980 support levels. The price is currently testing the $0.1990 area and there is a major declining channel forming with resistance near $0.2070 on the hourly chart of the XRP/USD pair.
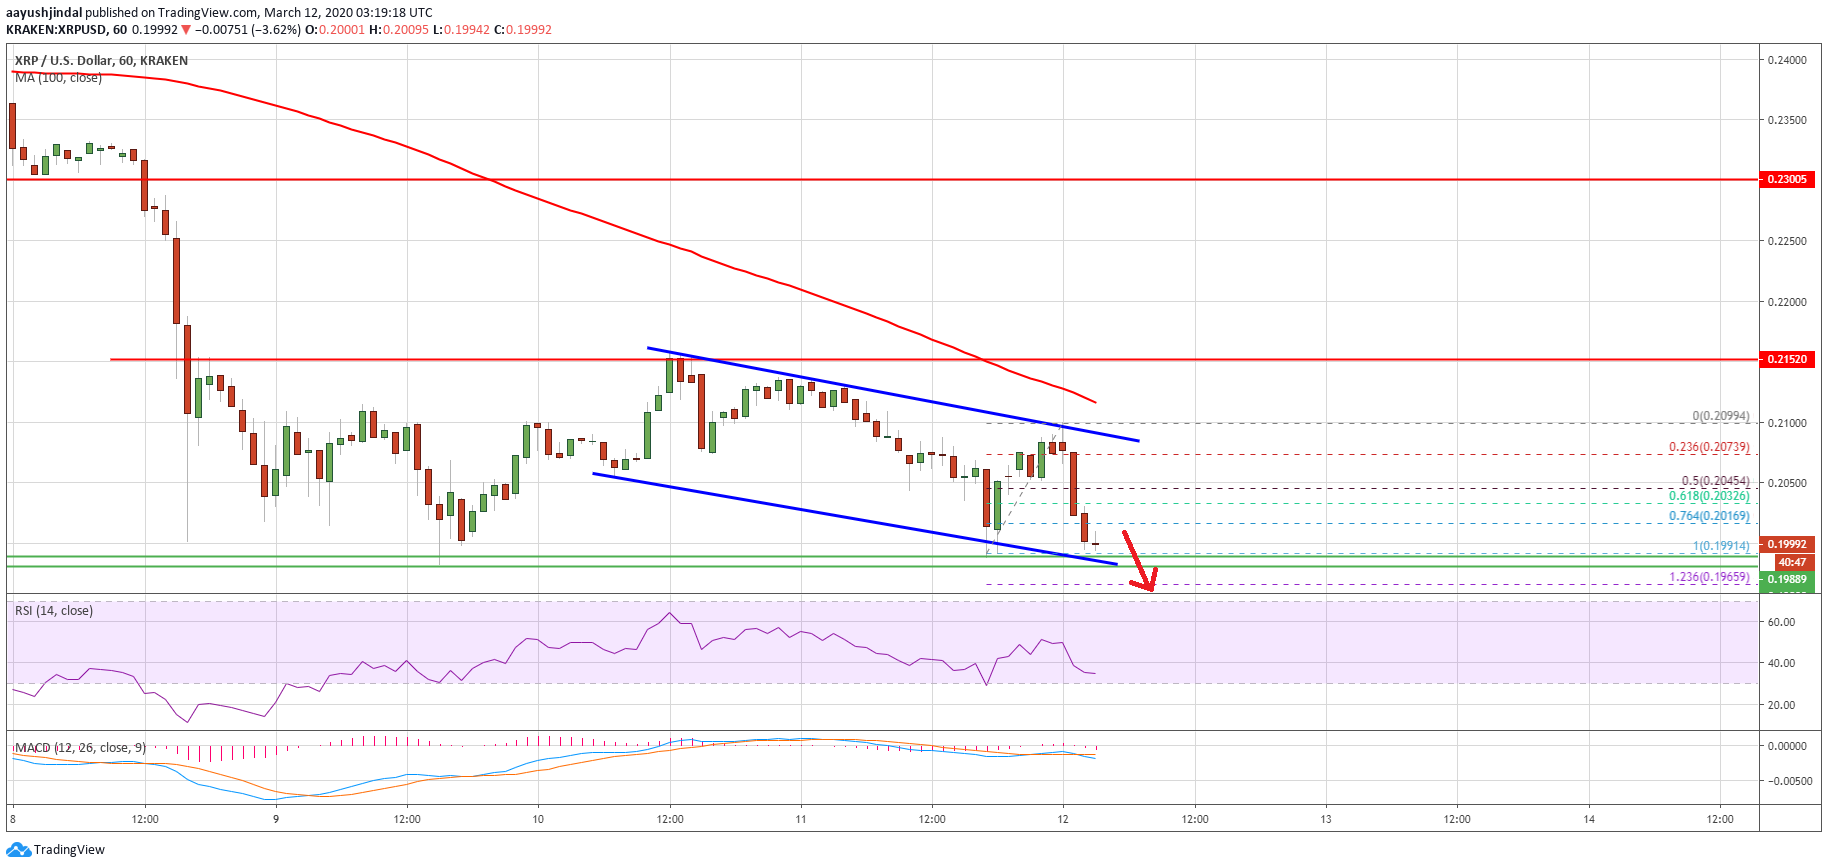
An initial support is near the $0.1965 level. It coincides with the 1.236 Fib extension level of the recent rise from the $0.1991 low to $0.2099 high.
The next key support is near the $0.1950 level, below which the price could test the $0.1920 level in the near term. Any further losses may perhaps lead the price towards the $0.1840 support level.
Another Rejection
There are also chances of another rejection near the $0.1980 support area. If ripple price stays above the $0.1980 support, it could start a short term upside correction.
On the upside, an initial resistance is near the $0.2050 level. The first key resistance is near the $0.2080 level and the channel upper trend line. A successful close above the channel resistance and a follow through above the $0.2100 resistance is needed to start a strong recovery wave in the coming sessions.
Technical Indicators
Hourly MACD – The MACD for XRP/USD is now gaining pace in the bearish zone.
Hourly RSI (Relative Strength Index) – The RSI for XRP/USD is now well below the 30 level.
Major Support Levels – $0.1980, $0.1965 and $0.1920.
Major Resistance Levels – $0.2050, $0.2080 and $0.2100.


