
Reason to trust
How Our News is Made
Strict editorial policy that focuses on accuracy, relevance, and impartiality
Ad discliamer
Morbi pretium leo et nisl aliquam mollis. Quisque arcu lorem, ultricies quis pellentesque nec, ullamcorper eu odio.
Bitcoin is trading in a positive zone against the US Dollar, especially after the fed interest rate cut . BTC price is likely to continue higher above the $8,900 and $9,000 resistance levels in the near term.
- Bitcoin is likely to gain traction after the recent breakout attempt against the US Dollar.
- The price is trading nicely above the $8,680 and $8,700 support levels.
- There is a key bullish breakout pattern forming with resistance near $8,840 on the hourly chart of the BTC/USD pair (data feed from Kraken).
- The pair is likely to surge higher once it clears the $8,840 and $8,900 resistance levels.
Bitcoin Likely To Surge Higher
In the past few sessions, bitcoin remained well bid above the $8,600 and levels against the US Dollar. BTC price traded as high as $8,967 before correcting lower below the $8,800 area.
There was a break below the 23.6% Fib retracement level of the upward move from the $8,398 swing low to $8,967 high. However, the bulls defended the key $8,680 support level and the 100 hourly simple moving average.
Besides, the 50% Fib retracement level of the upward move from the $8,398 swing low to $8,967 high is acting as a strong support. Bitcoin is now trading with a bullish angle above the $8,750 level and the Fib retracement level of the upward move from the $8,398 swing low to $8,967 high.
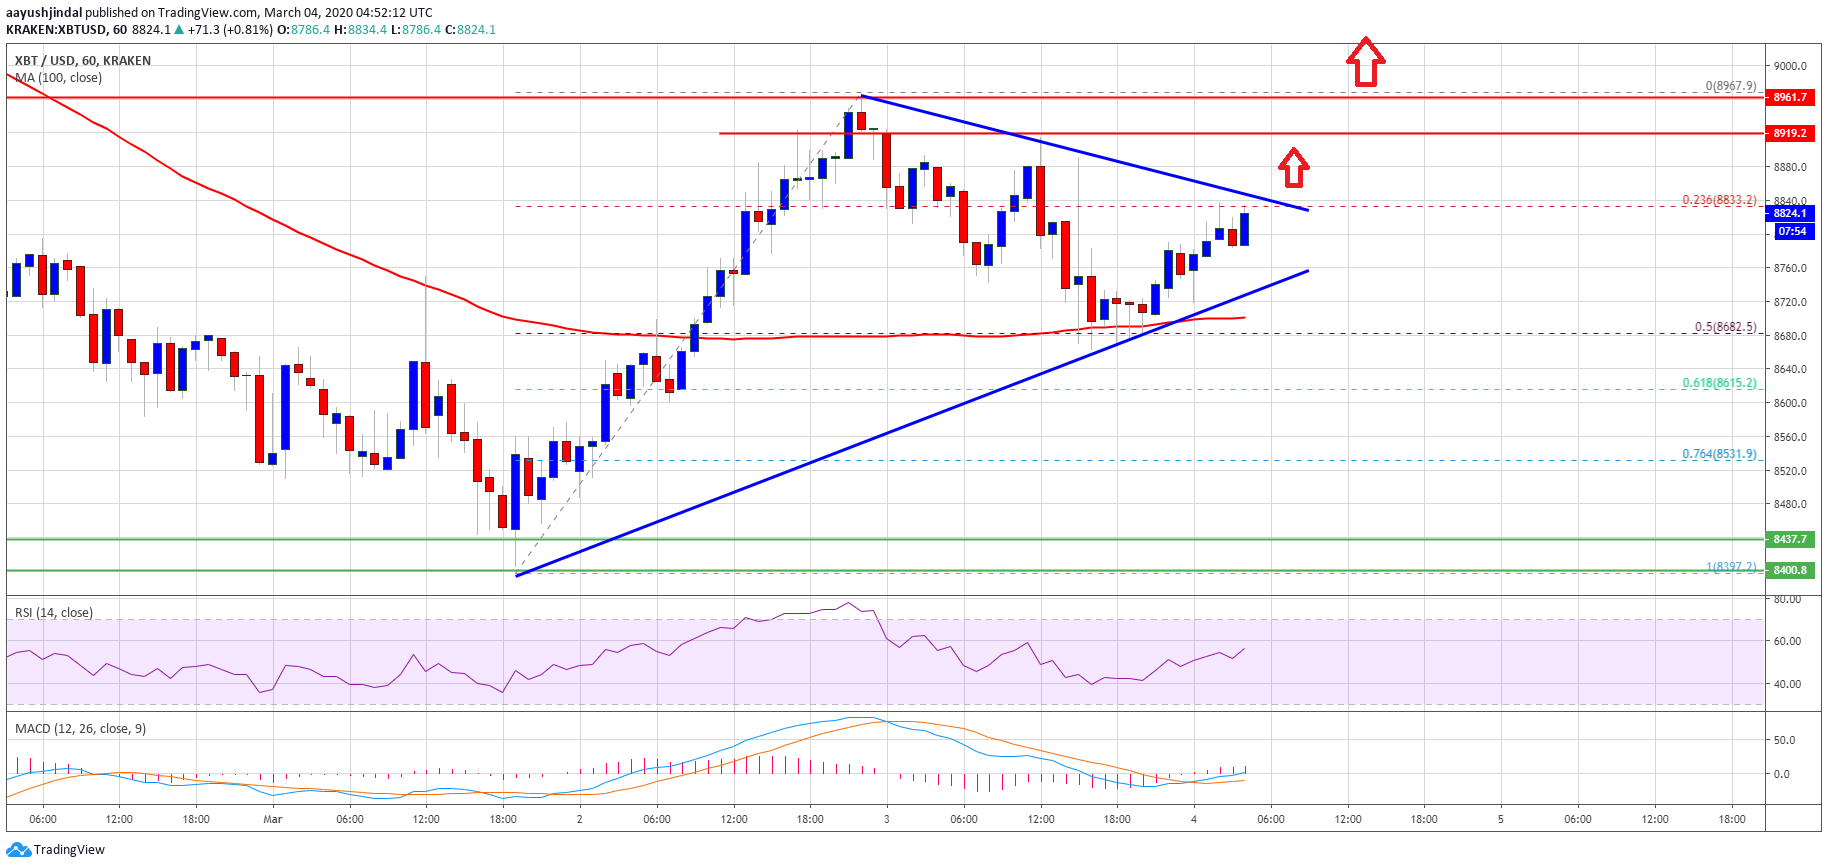
There is also a key bullish breakout pattern forming with resistance near $8,840 on the hourly chart of the BTC/USD pair. If there is an upside break above the triangle resistance, the price could make another attempt to gain bullish momentum above $8,900.
A successful close above the $8,900 and $9,000 levels is likely to set the pace for a larger upward move especially after the recent emergency rate cut by the fed. The next stop for the bulls may perhaps be $9,200 or $9,320.
100 SMA as a Key Support
On the downside, there are a few key supports near the $8,760 level and the triangle. The next major support for bitcoin is near the $8,700 level and the 100 hourly simple moving average.
If the price fails to stay above the $8,700 support and the 100 hourly simple moving average, there is a risk of another slide towards the $8,400 support area in the near term.
Technical indicators:
Hourly MACD – The MACD is now gaining pace in the bullish zone.
Hourly RSI (Relative Strength Index) – The RSI for BTC/USD is currently well above the 50 level.
Major Support Levels – $8,760 followed by $8,700.
Major Resistance Levels – $8,840, $8,900 and $9,000.


