
Reason to trust
How Our News is Made
Strict editorial policy that focuses on accuracy, relevance, and impartiality
Ad discliamer
Morbi pretium leo et nisl aliquam mollis. Quisque arcu lorem, ultricies quis pellentesque nec, ullamcorper eu odio.
Bitcoin price started a downside correction after rallying to a new 2020 high near $8,460 against the US Dollar. BTC corrected $500, but the price is still above many key supports.
- Bitcoin failed to continue above $8,500 and started a downside correction against the US Dollar.
- There was a significant correction below the $8,200 and $8,080 support levels.
- There is a connecting bullish trend line active with support near $7,930 on the hourly chart of the BTC/USD pair (data feed from Kraken).
- The pair is likely to bounce back as long as it is above the $7,800 support and the 100 hourly SMA.
Bitcoin Correcting Gains
This week, we saw a strong rise in bitcoin price above the $8,000 resistance against the US Dollar. BTC traded to a new 2020 high near $8,460 before it started a downside correction.
The bears were able to push the price below the $8,300 and $8,200 levels. During the decline, there was a break below a key bullish trend line with support near $8,040 on the hourly chart.
Besides, the price failed to stay above the $8,000 support area. Finally, it traded as low as $7,867 and is currently consolidating in a range. On the upside, there are initial hurdles near $8,000, and the 23.6% Fib retracement level of the recent decline from the $8,426 high to $7,867 low.
The first key resistance for bitcoin is near the $8,145 level. It represents the 50% Fib retracement level of the recent decline from the $8,426 high to $7,867 low.
If there is a clear break above the $8,145 and $8,200 levels, the price is likely to resume its upward move. The next major resistance is at $8,280, above which the bulls are likely to aim a new 2020 high.
What Could Invalidate Bullish Trend In BTC?
On the downside, there are a couple of key supports for bitcoin near the $7,800 level. More importantly, the 100 hourly simple moving average is near $7,800.
Therefore, a successful bearish close below $7,800 might invalidate the current bullish view. In the mentioned case, the price is likely to revisit the $7,500 support.
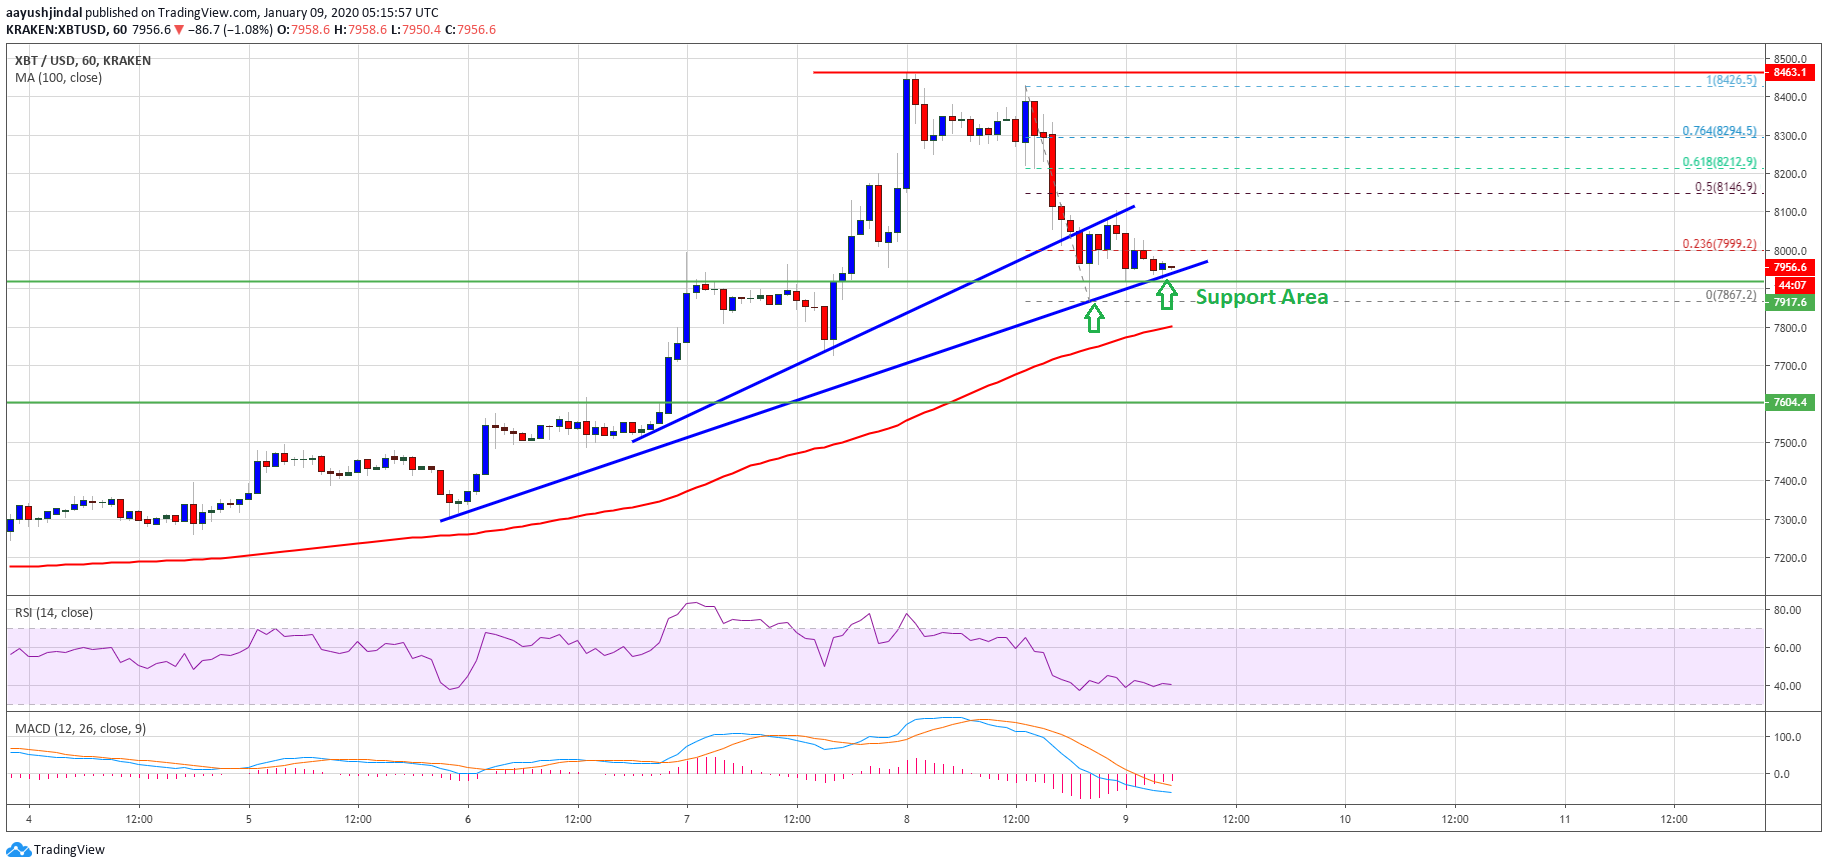
Looking at the chart, bitcoin price is clearly under stress below the $8,000 and $8,100 levels. In the short term, there could be a downside extension, but the price is likely to bounce back as long as it is above $7,800.
Technical indicators:
Hourly MACD – The MACD is slowly reducing its bearish slope.
Hourly RSI (Relative Strength Index) – The RSI for BTC/USD is currently well below the 50 level.
Major Support Levels – $7,860 followed by $7,800.
Major Resistance Levels – $8,000, $8,145 and $8,200.


