
Reason to trust
How Our News is Made
Strict editorial policy that focuses on accuracy, relevance, and impartiality
Ad discliamer
Morbi pretium leo et nisl aliquam mollis. Quisque arcu lorem, ultricies quis pellentesque nec, ullamcorper eu odio.
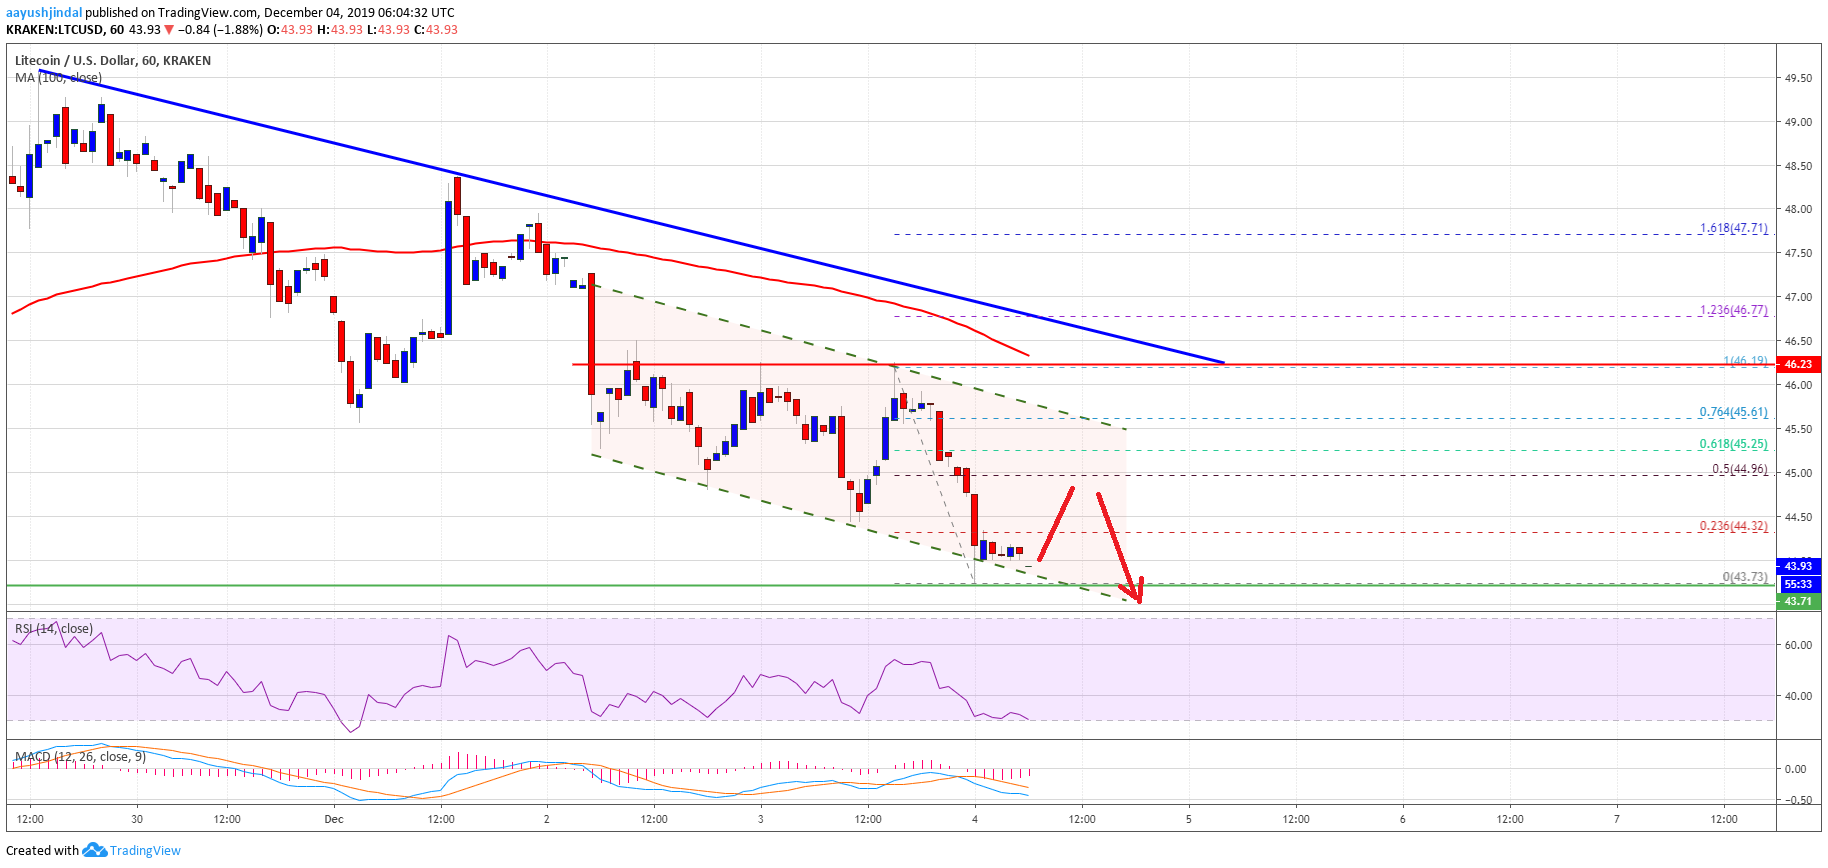
- Litecoin declined heavily after it failed to climb above $46.50 and $48.00 against the US Dollar.
- The price seems to be sliding towards the $42.20 and $40.40 support levels.
- There is a key declining channel forming with resistance near $45.50 on the hourly chart of the LTC/USD pair (data feed from Kraken).
- Bitcoin price is down around 3% and it is struggling to stay above the $7,040 and $7,000 support levels.
Litecoin price is following a nasty downtrend below the $46.50 resistance against the US Dollar. LTC could revisit $40.40 or $40.00 before it starts a decent recovery.
Litecoin Price Analysis
In the past few days, litecoin price mostly followed a bearish path below the $50.00 pivot level against the US Dollar. LTC price broke a couple of key supports near $46.50 and the 100 hourly simple moving average to enter a bearish zone.
Later, the price made a couple of attempts to surpass the $46.50 resistance area, but it failed. As a result, there was another decline and the price traded below the $45.25 and $44.50 support levels.
The recent low was near $43.73 and the price is currently consolidating losses. An initial resistance is near the $44.40 level. Besides, the 23.6% Fib retracement level of the recent decline from the $46.19 high to $43.73 low is also near the $44.40 level.
If there is an upside correction above $44.40, litecoin price could correct further towards the $45.00 resistance. It represents the 50% Fib retracement level of the recent decline from the $46.19 high to $43.73 low.
The next key resistance is near the $45.60 level. Additionally, there is a key declining channel forming with resistance near $45.50 on the hourly chart of the LTC/USD pair.
Therefore, the price must break the $45.00 and $45.50 resistance levels. Having said that, the $46.50 level is still a major barrier for the bulls, above which the price is likely to start a strong rise.
Conversely, the price is likely to continue lower below the $43.75 and $43.50 levels. An immediate support is near the $42.20 level, but the current price action suggests that the price could even test $40.40 or $40.00.
Looking at the chart, litecoin price is clearly trading in a bearish zone below the $45.00, $45.50 and $46.50 resistance levels. Thus, the price is likely to continue lower until there is a daily close above the $46.50 resistance.
Technical indicators:
Hourly MACD – The MACD is slowly reducing its slope in the bearish zone.
Hourly RSI (Relative Strength Index) – The RSI for LTC/USD is currently well below the 40 level.
Major Support Levels – $42.20 followed by $40.40.
Major Resistance Levels – $45.50 and $46.50.


