
Reason to trust
How Our News is Made
Strict editorial policy that focuses on accuracy, relevance, and impartiality
Ad discliamer
Morbi pretium leo et nisl aliquam mollis. Quisque arcu lorem, ultricies quis pellentesque nec, ullamcorper eu odio.
- Bitcoin price is declining and approaching the next bearish target of $6,500 against the US Dollar.
- The price is down close to 10% and it seems like the bears are targeting $6,500 or $6,400.
- There is a new connecting bearish trend line forming with resistance near $7,010 on the hourly chart of the BTC/USD pair (data feed from Kraken).
- The bulls are likely to take a stand near the main $6,500 support (the medium term outlook bearish target).
Bitcoin price is approaching the key $6,500 support area against the US Dollar. There are high chances of BTC finding bids near $6,500 and starting an upside correction.
Bitcoin Price Analysis
This past week, we discussed the chances of more downsides below $7,500 in bitcoin price against the US Dollar. BTC did decline and broke the first key bearish target near the $7,000 level.
Moreover, the price broke the $6,800 support zone and settled well below the 100 hourly simple moving average. It opened the doors for more losses below $6,700 and the price traded as low as $6,575 (close to the main bearish target of $6,500 as discussed in the last medium term outlook).
At the moment, the price is consolidating losses above $6,600. Besides, it is testing the 23.6% Fib retracement level of the recent downward move from the $7,279 high to $6,575 low.
On the upsides, there are many resistances near the $6,880, $6,900 and $6,930 levels. The first major resistance is near the $6,930 level since it is close to the 50% Fib retracement level of the recent downward move from the $7,279 high to $6,575 low.
Additionally, there is a new connecting bearish trend line forming with resistance near $7,010 on the hourly chart of the BTC/USD pair. Therefore, bitcoin price needs to climb above the $6,930 and $7,000 resistance levels to start a decent recovery.
The next major resistance is near the $7,360 level and the 100 hourly simple moving average. Conversely, the price may perhaps continue to move down below $6,600.
The main support is near the $6,500 level, where the bulls are likely to put up a strong fight. Any further losses could decrease the chances of a short term correction and the price might decline towards $6,400 or $6,200.
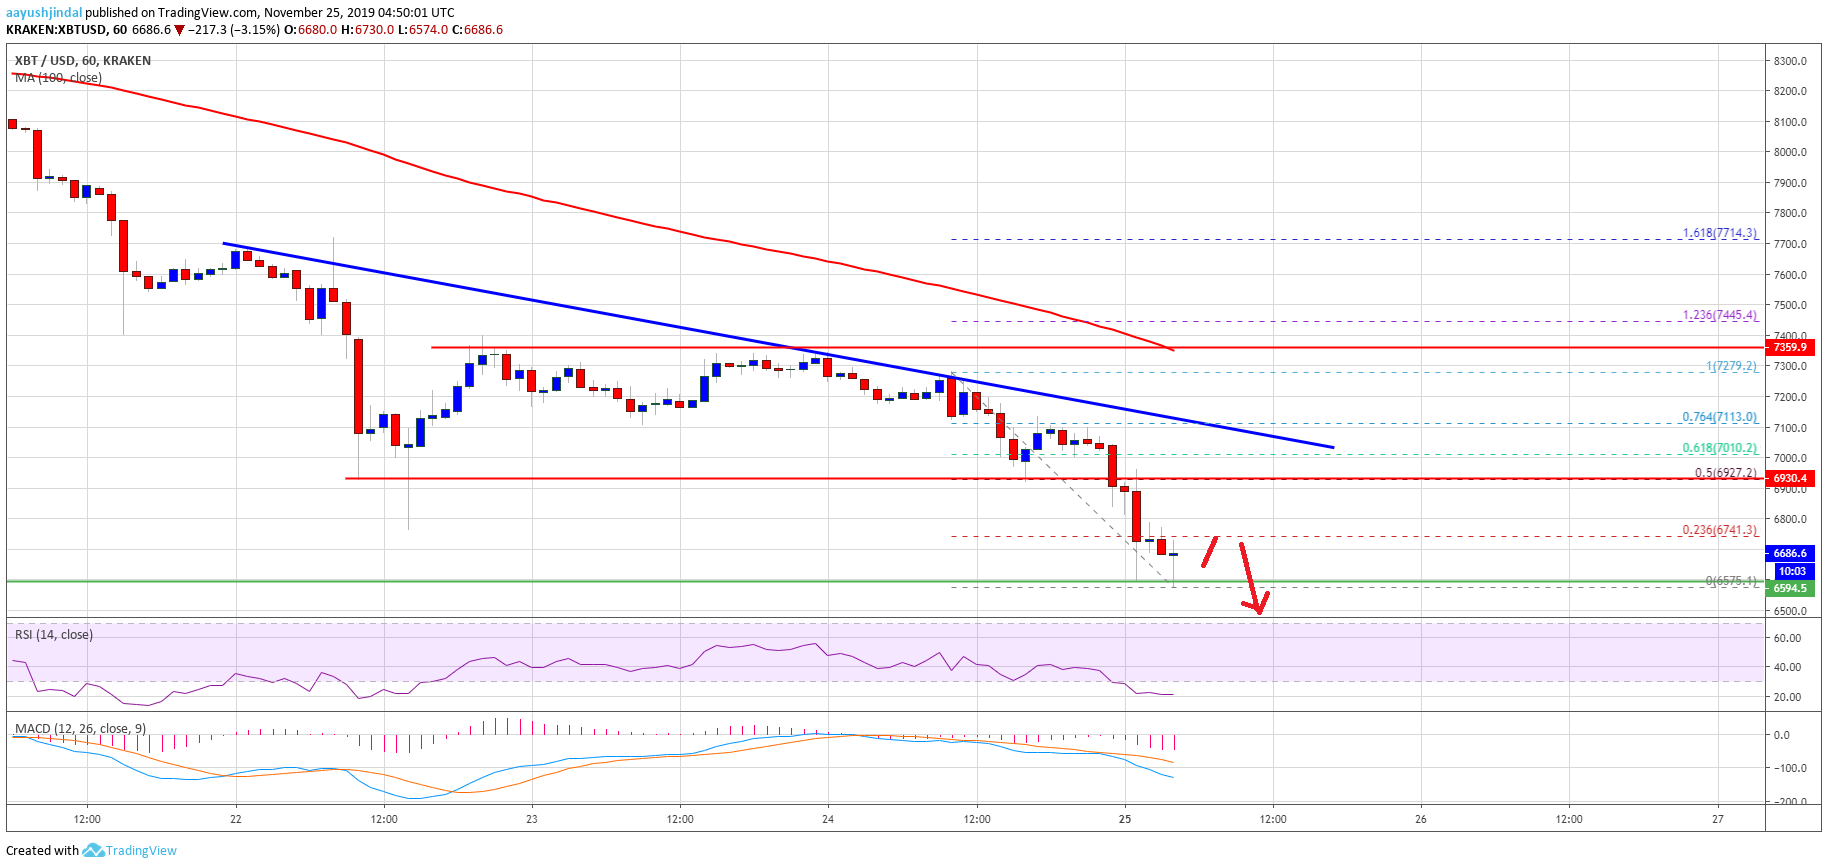
Looking at the chart, bitcoin price is clearly struggling to correct above $6,800. Thus, there remains a risk of another slide or spike towards $6,500 and $6,400 before an upside correction.
Technical indicators:
Hourly MACD – The MACD is currently gaining momentum in the bearish zone.
Hourly RSI (Relative Strength Index) – The RSI for BTC/USD is currently moving further into the bearish zone.
Major Support Levels – $6,500 followed by $6,400.
Major Resistance Levels – $6,880, $6,920 and $7,000.


