
Reason to trust
How Our News is Made
Strict editorial policy that focuses on accuracy, relevance, and impartiality
Ad discliamer
Morbi pretium leo et nisl aliquam mollis. Quisque arcu lorem, ultricies quis pellentesque nec, ullamcorper eu odio.
- ETH price found support near the $178 zone and is correcting higher against the US Dollar.
- The price is currently consolidating above the $180 support area, with a few positive signs.
- There is a major bullish trend line forming with support near $182 on the 4-hours chart of ETH/USD (data feed via Kraken).
- The pair remains well supported on the downside near the $182, $180 and $178 levels.
Ethereum price is likely to climb above the $185 resistance against the US Dollar, while consolidating vs bitcoin. ETH price must stay above $178 to resume its upward move.
Ethereum Price Weekly Analysis
This past week, Ethereum started a downside correction below the $188 and $185 supports against the US Dollar. Moreover, ETH traded below the $182 and $180 support levels.
However, the $178 support area (the previous resistance) acted as a strong support. Besides, the price managed to stay above the $175 pivot and the 100 simple moving average (4-hours).
As a result, the price started a slow rise above the $180 resistance. There was a break above the 23.6% Fib retracement level of the downward move from the $194 swing high to $178 swing low. The price even climbed above the $184 level, but it seems like it is facing hurdles near $185-$186.
Additionally, the 50% Fib retracement level of the downward move from the $194 swing high to $178 swing low is currently acting as a resistance. Therefore, an upside break above the $185 and $186 resistance levels could set the pace for more gains.
The next key resistance is near the $190 area, above which Ethereum will most likely surge towards the $200 and $205 resistance levels. On the downside, there is a major bullish trend line forming with support near $182 on the 4-hours chart of ETH/USD.
If there is a fresh decline below the trend line, the price could find support near the $180 level and the 100 simple moving average (4-hours). The main support is near the $178 level, below which there is a risk of an extended decline in the coming days.
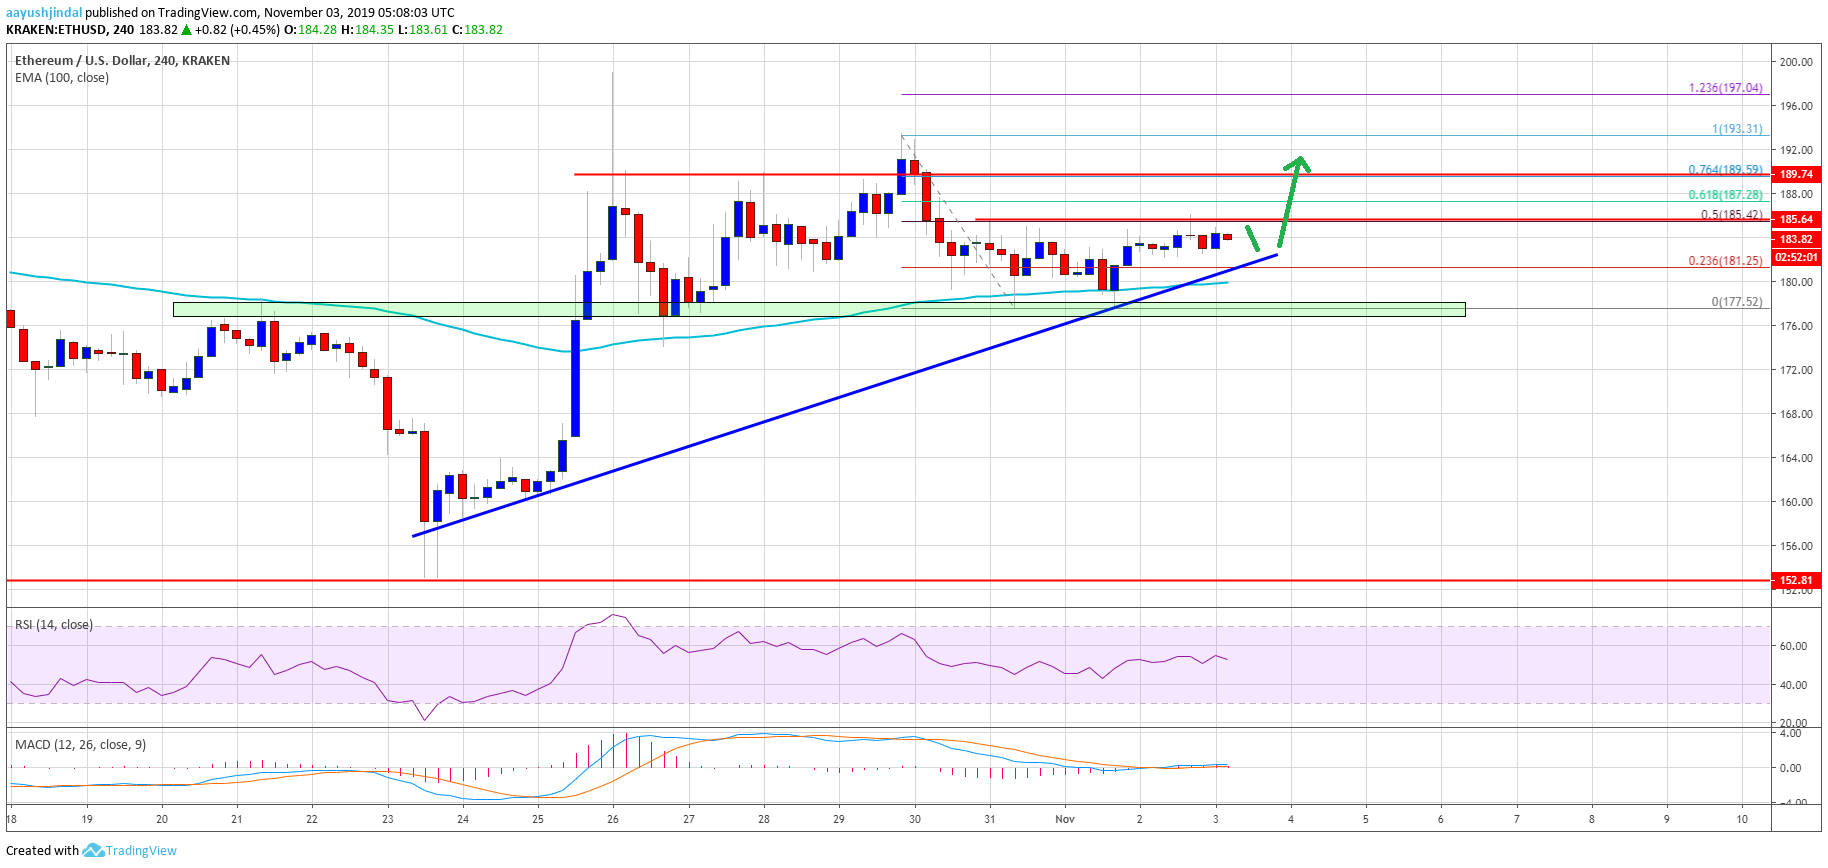
The above chart indicates that Ethereum price likely to break the $185 and $186 resistance levels. In the mentioned bullish case, the price is likely to continue higher towards the $190 and $200 levels. Conversely, the $180 and $178 support levels holds the key. If there is a bearish break below $178, the price may perhaps test $175 and $166.
Technical Indicators
4 hours MACD – The MACD for ETH/USD is mostly flat in the bearish zone.
4 hours RSI – The RSI for ETH/USD is currently above the 50 level, with a minor bearish angle.
Major Support Level – $178
Major Resistance Level – $186


