
Reason to trust
How Our News is Made
Strict editorial policy that focuses on accuracy, relevance, and impartiality
Ad discliamer
Morbi pretium leo et nisl aliquam mollis. Quisque arcu lorem, ultricies quis pellentesque nec, ullamcorper eu odio.
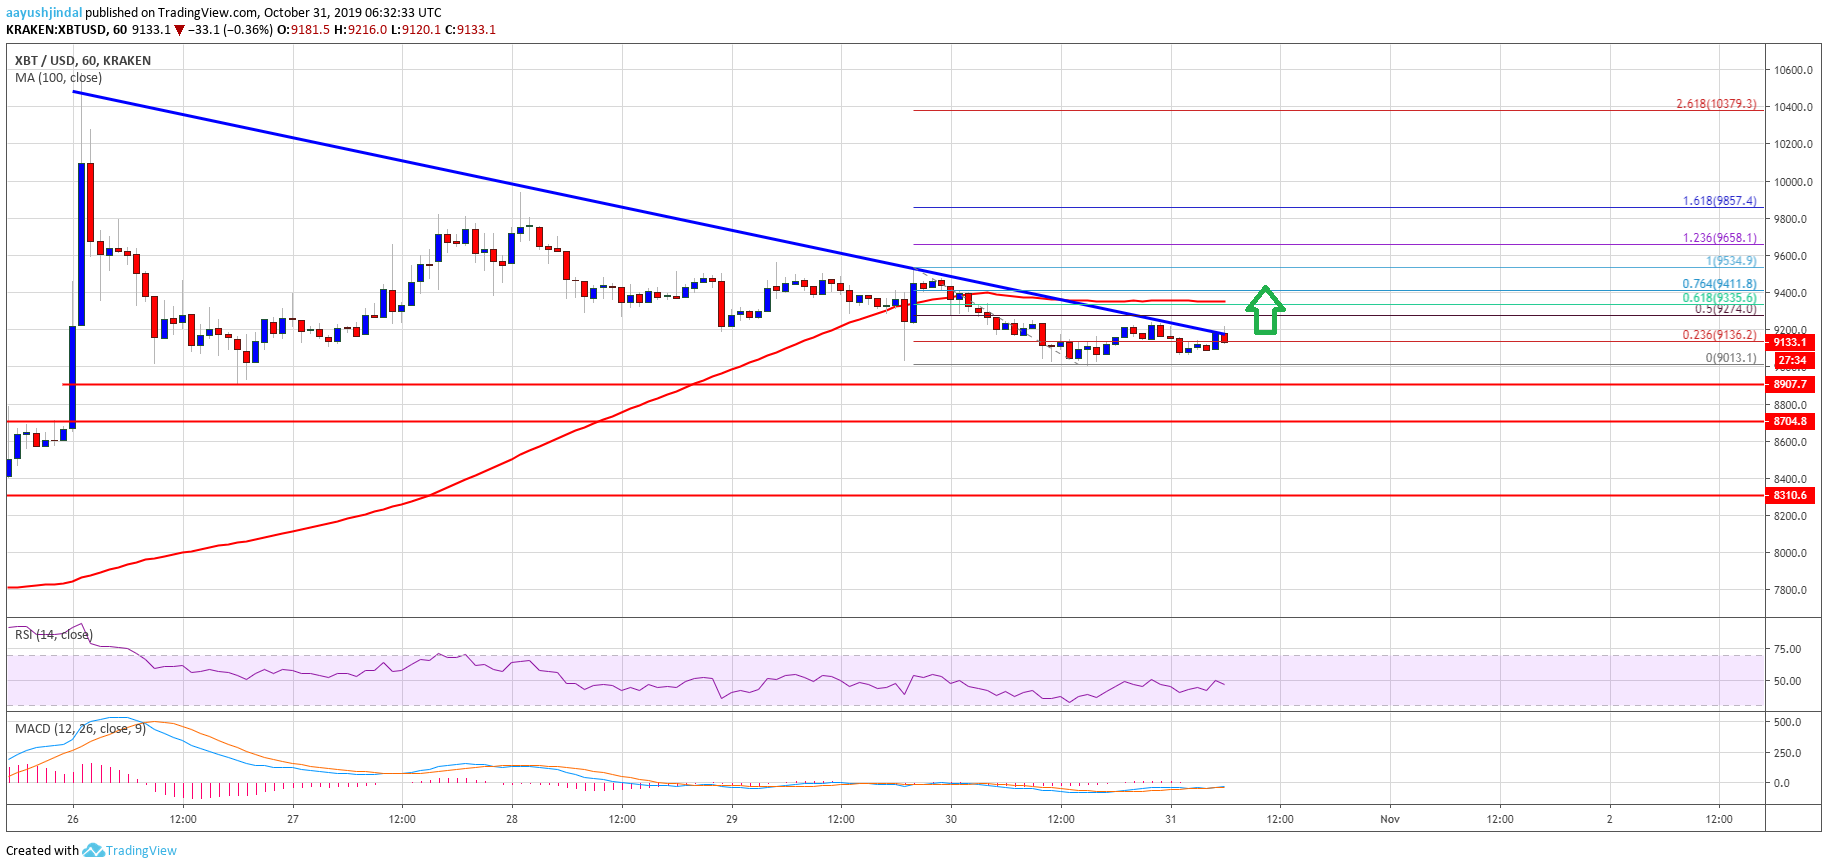
- Bitcoin price is holding the key $9,000 support area against the US Dollar.
- The price is facing a couple of short term resistances near the $9,200 and $9,400 levels.
- This week’s followed major bearish trend line is active with resistance near $9,150 on the hourly chart of the BTC/USD pair (data feed from Kraken).
- The price is likely to rally if it breaks the $9,200 resistance and the $9,320 pivot level.
Bitcoin price is showing a lot of positive signs above $9,000 against the US Dollar. Overall, BTC is likely rally once again above the $9,200 and $9,320 resistances.
Bitcoin Price Analysis
Recently, there were mostly range moves above the $9,000 support area against the US Dollar. BTC corrected lower below the $9,150 level and settled below the 100 hourly simple moving average.
The recent low was formed near the $9,013 and the price is currently holding the $9,000 support area. It is climbing higher and trading above the $9,100 level. Moreover, there was a break above the 23.6% Fib retracement level of the recent decline from the $9,534 high to $9,013 low.
However, the price seems to be facing resistance near $9,200 and the 100 hourly simple moving average. Additionally, this week’s followed major bearish trend line is active with resistance near $9,150 on the hourly chart of the BTC/USD pair.
Above the trend line, the 50% Fib retracement level of the recent decline from the $9,534 high to $9,013 low is near the $9,275 area. Therefore, the price could start a solid rise if there is a break above the $9,200 and $9,275 resistances.
An immediate resistance is near the $9,320 level and the 100 hourly simple moving average. Besides, the 76.4% Fib retracement level of the recent decline from the $9,534 high to $9,013 low is also near the $9,400 area.
A successful close above the $9,400 level is must for bitcoin to move into a positive zone. On the downside, there is a strong support forming near the $9,000 area. If there is a bearish break below $9,000, the price could start a strong decline towards $8,800 or $8,700.
Looking at the chart, bitcoin is clearly trading nicely above the $9,000 support area, which holds the key. An upside break above the $9,200 and $9,320 levels is must for a fresh increase. If not, there could be a bearish wave below $9,000.
Technical indicators:
Hourly MACD – The MACD is struggling to gain pace in the bullish zone.
Hourly RSI (Relative Strength Index) – The RSI for BTC/USD is facing hurdles near the 45 and 50 levels.
Major Support Levels – $9,000 followed by $8,800.
Major Resistance Levels – $9,200, $9,320 and $9,400.


