
Reason to trust
How Our News is Made
Strict editorial policy that focuses on accuracy, relevance, and impartiality
Ad discliamer
Morbi pretium leo et nisl aliquam mollis. Quisque arcu lorem, ultricies quis pellentesque nec, ullamcorper eu odio.
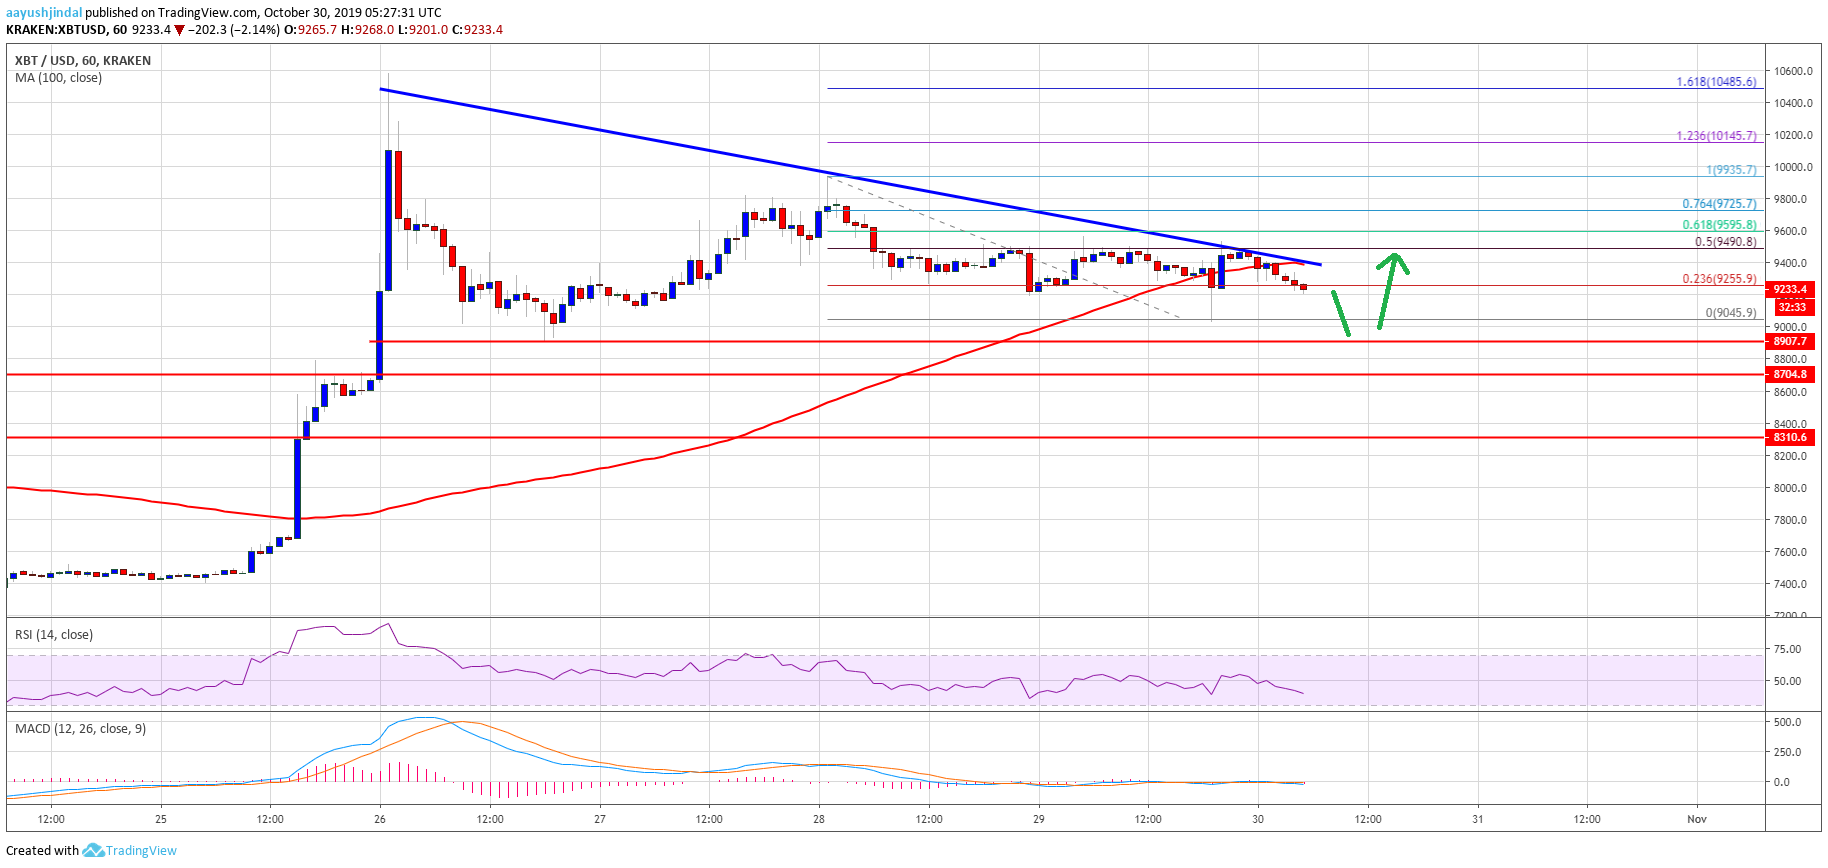
- Bitcoin price is currently correcting lower and is trading below $9,500 against the US Dollar.
- The price is likely to decline further towards $8,700 before it could rise again.
- Yesterday’s highlighted key bearish trend line is intact with resistance near $9,460 on the hourly chart of the BTC/USD pair (data feed from Kraken).
- The price must surpass the $9,460 and $9,500 resistance levels to start a fresh increase.
Bitcoin price is facing a few key hurdles near $9,500 against the US Dollar. Therefore, BTC could dip a few points before a fresh increase in the near term.
Bitcoin Price Analysis
Recently, there was an extended downside correction in bitcoin below the $9,200 support area against the US Dollar. BTC even traded below the $9,100 level and formed a new weekly low near $9,045.
The price recovered from $9,045 and traded above the $9,200 resistance. Moreover, there was a break above the 23.6% Fib retracement level of the recent decline from the $9,935 high to $9,045 low.
Bitcoin even climbed above the $9,400 level and the 100 hourly simple moving average. However, the upward move was capped by the $9,500 resistance area. Besides, the 50% Fib retracement level of the recent decline from the $9,935 high to $9,045 low acted as a resistance.
More importantly, yesterday’s highlighted key bearish trend line is intact with resistance near $9,460 on the hourly chart of the BTC/USD pair. The 100 hourly SMA is also near the trend line and $9,500.
Therefore, a clear break above the trend line and the 100 hourly SMA could open the doors for a fresh increase above the $9,500 resistance. The next key resistances are near the $9,725 and $9,880 levels.
On the downside, there are many supports near the $9,040 and $9,000 levels. It seems like the price could spike below the $9,000 support area and test $8,800 or $8,700. Once the current wave completes near the $8,800 or $8,700 support, the price is likely to bounce back in the coming sessions.
Looking at the chart, bitcoin is clearly facing a lot of hurdles near the $9,460 and $9,500 levels. Unless there is a close above $9,500, there is a risk of an extended drop towards the $9,000 and $8,800 support levels in the near term. Conversely, a successful close above $9,500 is likely to start a fresh bullish wave towards the $9,800 and $9,950 levels.
Technical indicators:
Hourly MACD – The MACD is gaining pace in the bearish zone.
Hourly RSI (Relative Strength Index) – The RSI for BTC/USD is moving lower and it is currently below the 50 level.
Major Support Levels – $9,000 followed by $8,800.
Major Resistance Levels – $9,460, $9,500 and $9,720.


