
Reason to trust
How Our News is Made
Strict editorial policy that focuses on accuracy, relevance, and impartiality
Ad discliamer
Morbi pretium leo et nisl aliquam mollis. Quisque arcu lorem, ultricies quis pellentesque nec, ullamcorper eu odio.
- ETH price extended gains above the $215 resistance area against the US Dollar.
- The price is currently correcting lower and is trading below the $212 support area.
- There was a break below yesterday’s highlighted bullish trend line with support near $211 on the hourly chart of ETH/USD (data feed via Kraken).
- The pair is likely to correct further lower towards the $200 support area in the near term.
Ethereum price is currently correcting gains versus the US Dollar and bitcoin. ETH price might soon test the $200 support area before it starts a fresh increase.
Ethereum Price Analysis
Yesterday, we saw a solid upward move in ETH price above the $200 resistance against the US Dollar. The price even broke the $210 level and settled well above the 100 hourly simple moving average. As a result, the price extended gains above the $215 level and posted a new monthly high near $218. On the other hand, bitcoin price remained in a bearish zone and settled below the $10,200 level.
At the moment, Ethereum is correcting gains below the $212 support area. Additionally, there was a break below the 23.6% Fib retracement level of the upward move from the $188 low to $218 high. More importantly, there was a break below yesterday’s highlighted bullish trend line with support near $211 on the hourly chart of ETH/USD. It opened the doors for more downsides and the price is now trading below $210.
An immediate support on the downside is near the $204 level. It coincides with the 50% Fib retracement level of the upward move from the $188 low to $218 high. However, the main support is near the $200 level and the 100 hourly SMA. Moreover, the 61.8% Fib retracement level of the upward move from the $188 low to $218 high is also near the $200 area.
Therefore, the price is likely to find support if it corrects lower towards the $204 or $200 levels. On the upside, there is a short term resistance forming near the $210 level and a connecting bearish trend line on the same chart. If there is an upside break above $210, the price could resume its upward move in the near term.
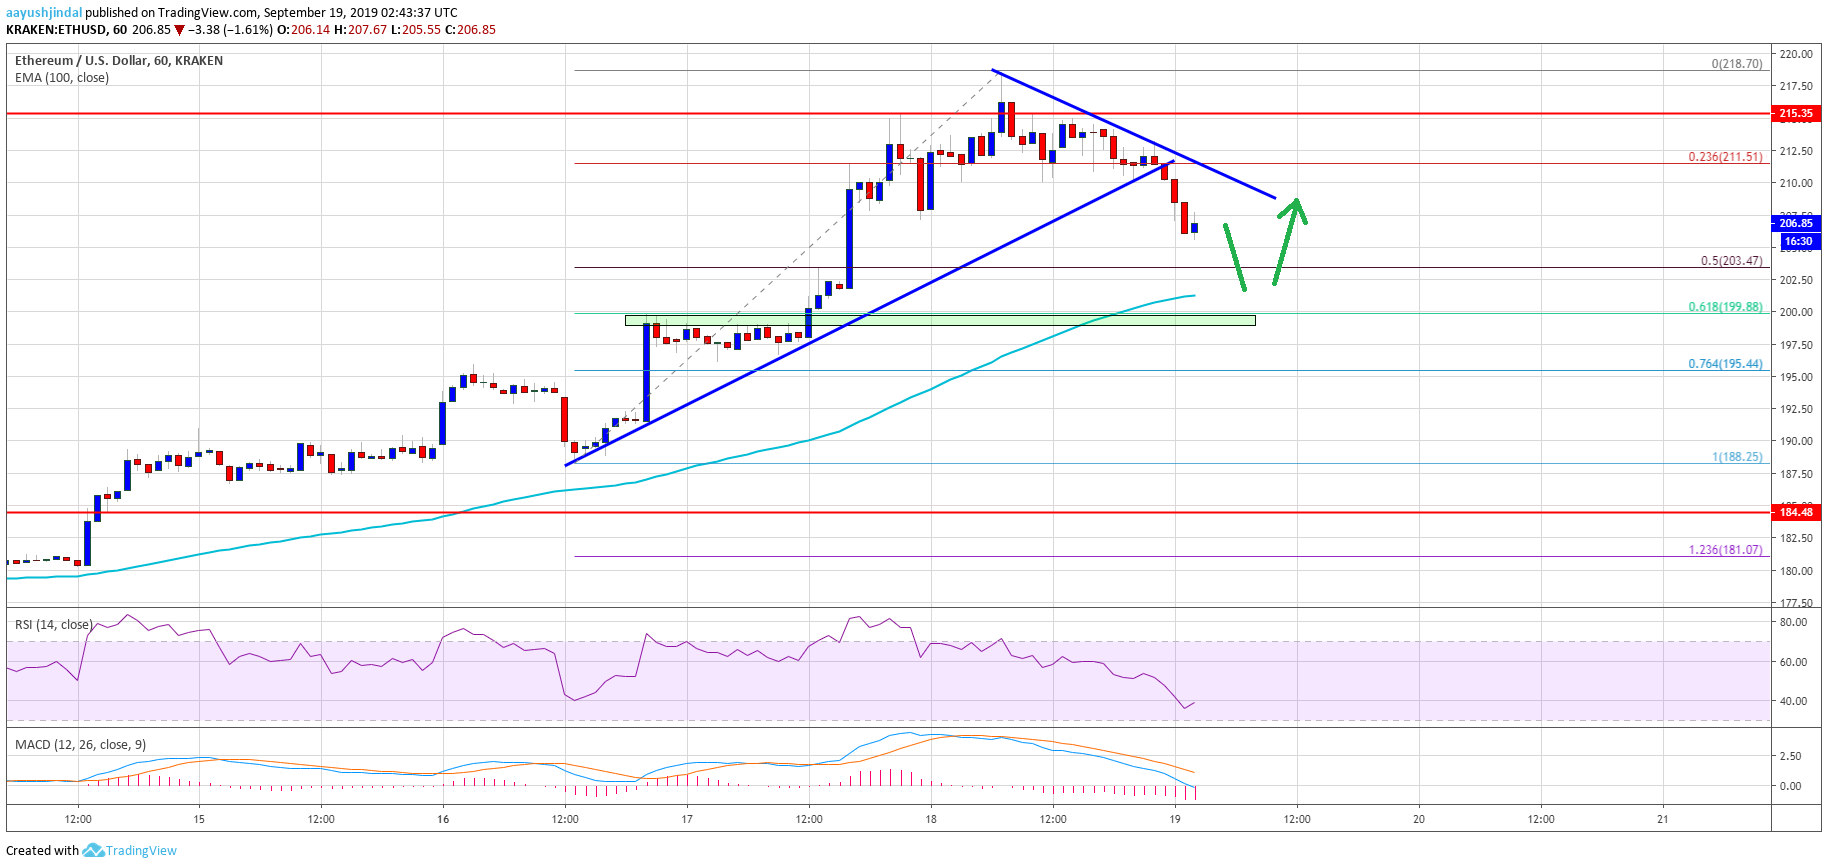
Looking at the chart, Ethereum price is clearly correcting lower below the $210 support area. It seems like the price might revisit the $200 support area and the 100 hourly SMA. Once the current correction phase is complete, the price could start a solid upward move.
ETH Technical Indicators
Hourly MACD – The MACD for ETH/USD is currently gaining pace in the bullish zone.
Hourly RSI – The RSI for ETH/USD is currently well above the 50 level.
Major Support Level – $204
Major Resistance Level – $212


