
Reason to trust
How Our News is Made
Strict editorial policy that focuses on accuracy, relevance, and impartiality
Ad discliamer
Morbi pretium leo et nisl aliquam mollis. Quisque arcu lorem, ultricies quis pellentesque nec, ullamcorper eu odio.
- Bitcoin price failed to hold the key $10,300 and $10,250 support levels against the US Dollar.
- The price is currently trading with a bearish bias and recently tested the $10,000 support area.
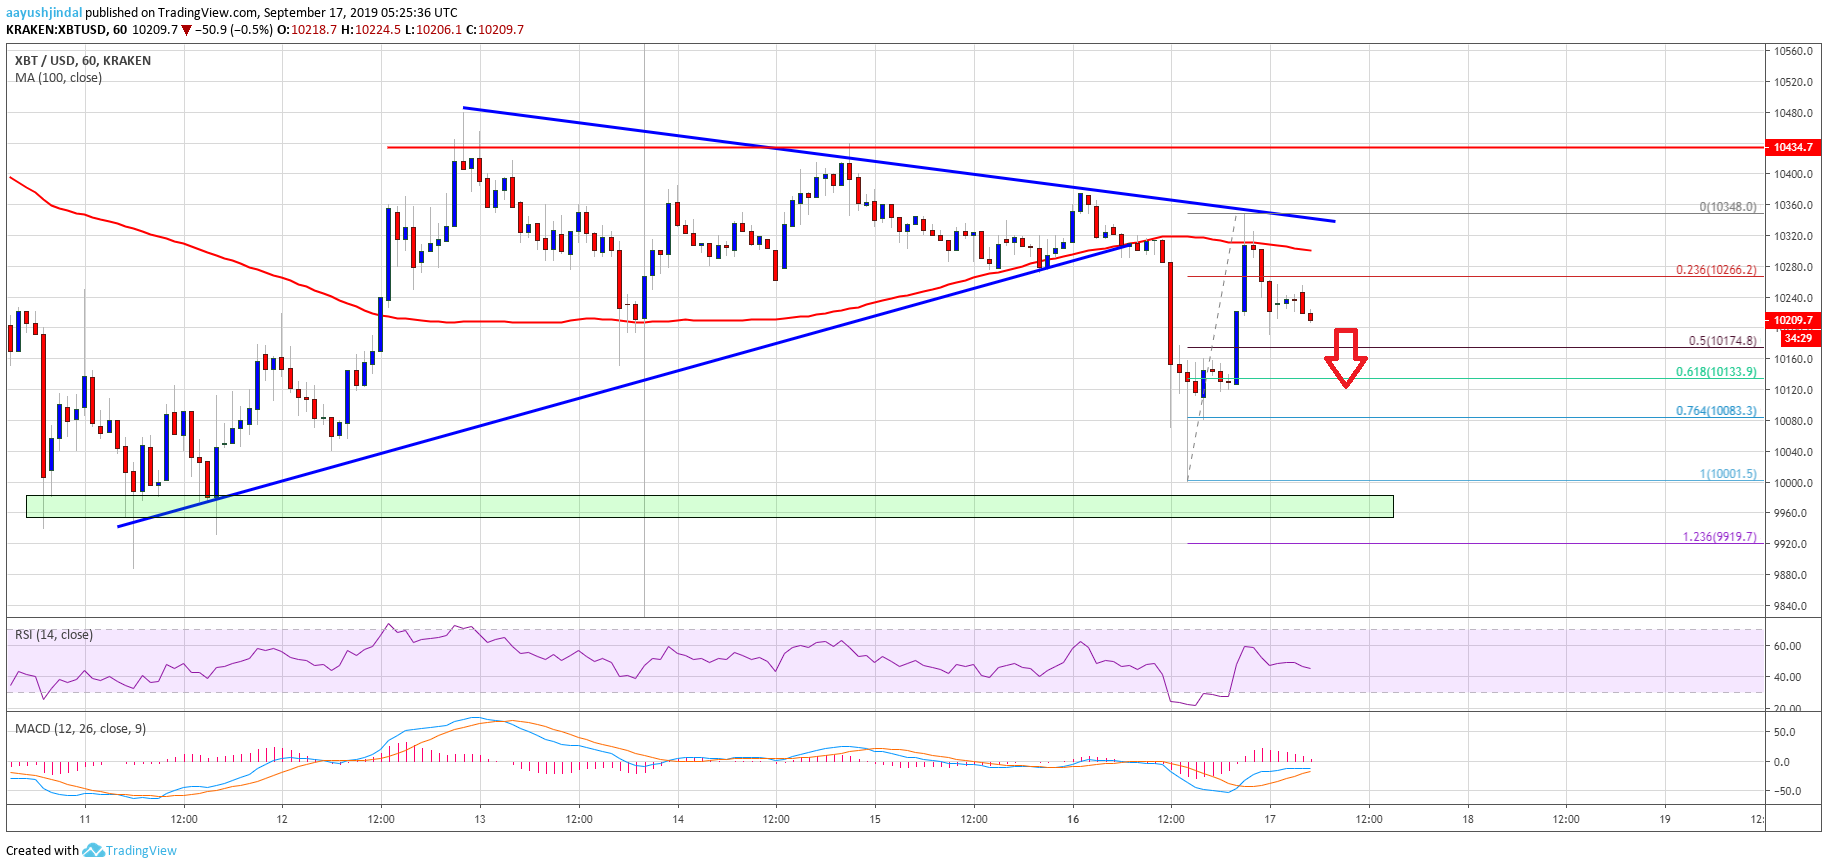
- There is a key bearish trend line forming with resistance near $10,340 on the hourly chart of the BTC/USD pair (data feed from Kraken).
- The price is likely to revisit the $10,000 support level as long as it is below $10,400.
Bitcoin price is trading with an increased bearish bias against the US Dollar. BTC might accelerate its decline below $10,200 in the coming sessions.
Bitcoin Price Analysis
Yesterday, we discussed the importance of the $10,250 support for bitcoin against the US Dollar. The pair remained in a negative zone below the $10,400 resistance level and the 100 hourly simple moving average. As a result, there was a bearish reaction below the key $10,300 and $10,250 support levels. During the decline, there was a break below yesterday’s highlighted breakout pattern with support near $10,320 on the hourly chart of BTC/USD.
The decline gained pace below the $10,200 level. Moreover, the price spiked below $10,150 and tested the $10,000 support level. Recently, it recovered and climbed back above $10,300. However, the upward move was capped by the $10,350 level and the 100 hourly simple moving average. More importantly, there is a key bearish trend line forming with resistance near $10,340 on the same chart.
The pair is currently declining and is trading below the 23.6% Fib retracement level of the recent recovery from the $10,000 swing low to $10,348 high. On the downside, an immediate support is near the $10,175 level. It represents the 50% Fib retracement level of the recent recovery from the $10,000 swing low to $10,348 high. The main supports on the downside are near the $10,000 and $9,900 levels.
On the upside, there are many resistances near the $10,300, $10,350 and $10,400 levels. The main resistance is still near the $10,500 level. A successful break above the $10,400 level and a follow through above $10,500 is needed for upside acceleration in the near term.
Looking at the chart, bitcoin price is trading in a bearish zone below the $10,300 and $10,400 levels. Therefore, there is a risk of more downsides below $10,200. It seems like the price may perhaps revisit the $10,000 support. Additionally, if the bears remain in action, the price could test the key $9,900 support area.
Technical indicators:
Hourly MACD – The MACD is slowly moving into the bearish zone.
Hourly RSI (Relative Strength Index) – The RSI for BTC/USD is now below the 50 level, with a bearish angle.
Major Support Levels – $10,175 followed by $10,000.
Major Resistance Levels – $10,300, $10,340 and $10,400.


