
Reason to trust
How Our News is Made
Strict editorial policy that focuses on accuracy, relevance, and impartiality
Ad discliamer
Morbi pretium leo et nisl aliquam mollis. Quisque arcu lorem, ultricies quis pellentesque nec, ullamcorper eu odio.
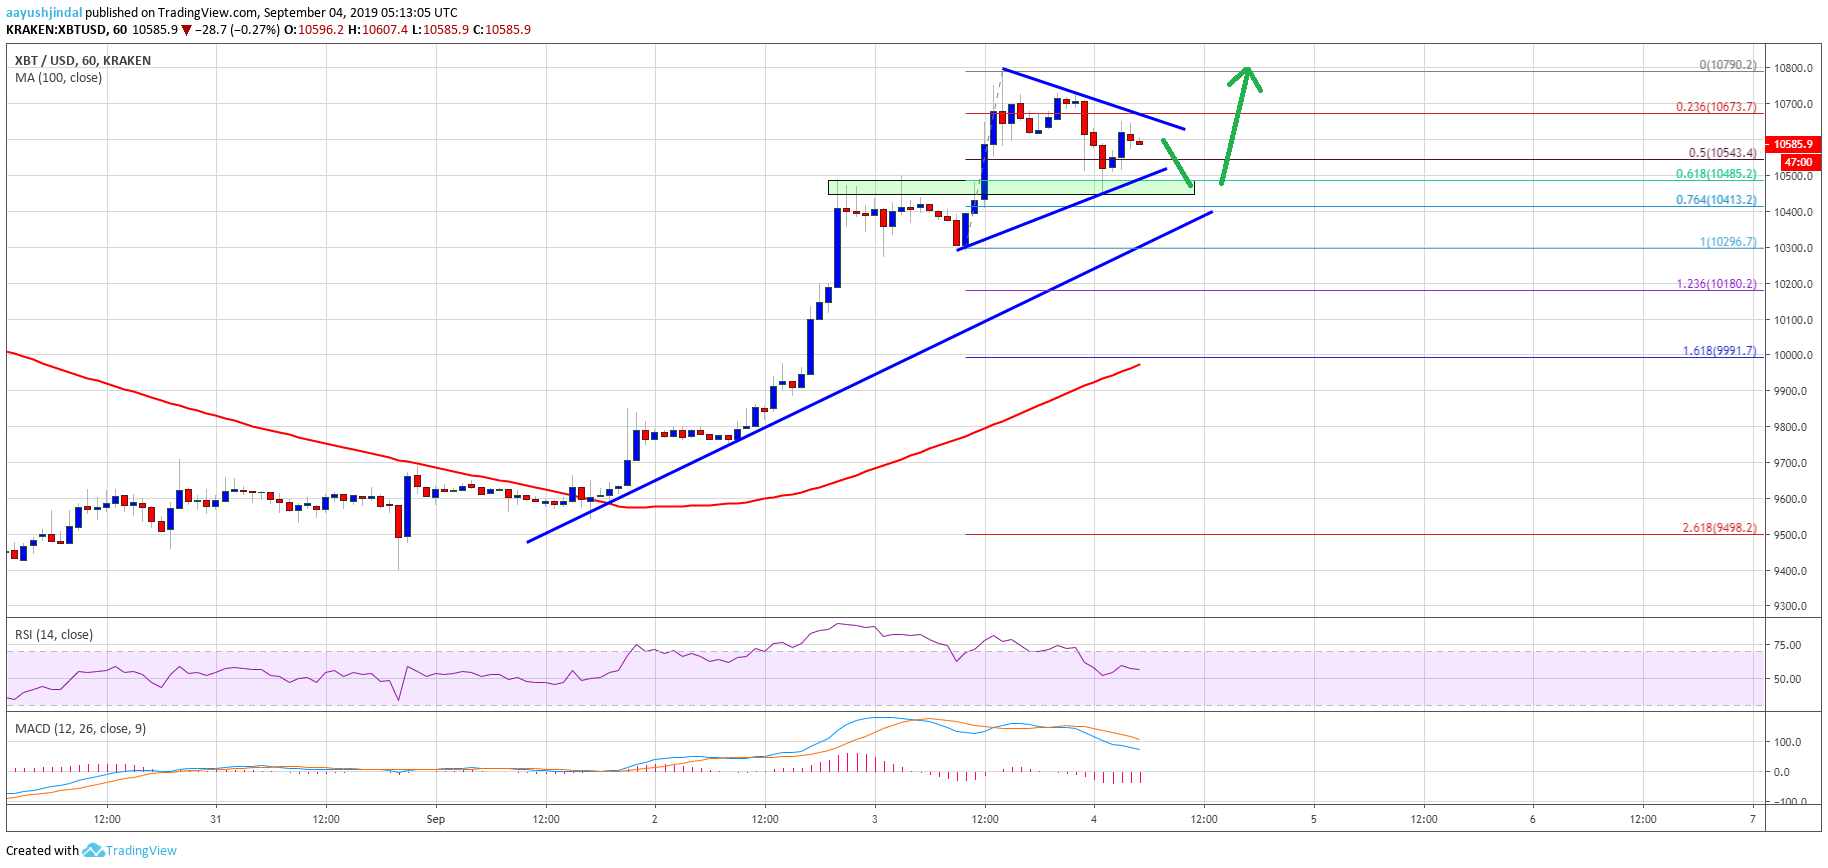
- Bitcoin price extended its rally and climbed above the $10,500 and $10,650 resistances against the US Dollar.
- The price is currently correcting lower after trading to a new monthly high at $10,790.
- There is a major bullish trend line forming with support near $10,400 on the hourly chart of the BTC/USD pair (data feed from Kraken).
- The price is showing positive signs and it remains well bid near $10,500 and $10,400.
Bitcoin price is gaining bullish momentum above $10,500 against the US Dollar. BTC might correct lower, but it is likely to bounce back from the $10,400 support.
Bitcoin Price Analysis
Yesterday, we saw a nice upward move in BTC, Ethereum and ripple against the US Dollar. The bulls gained traction and pushed bitcoin above the $10,400 and $10,500 resistance levels. Moreover, there was a close above the $10,500 resistance and the 100 hourly simple moving average. It opened the doors for more gains and the price climbed above the $10,650 resistance.
Finally, a new monthly high was formed near $10,790 and the price is currently correcting lower. It broke the $10,650 level plus the 23.6% Fib retracement level of the upward move from the $10,296 low to $10,790 high. However, the decline found support near the $10,450 level. Additionally, there is a major bullish trend line forming with support near $10,400 on the hourly chart of the BTC/USD pair.
Bitcoin stayed well above the 61.8% Fib retracement level of the upward move from the $10,296 low to $10,790 high. At the moment, there is a contracting triangle forming with support near $10,450 on the same chart. In the short term, the price could decline towards the $10,450 and $10,400 support levels. As long as the price is above $10,400, there could be another rise towards the $10,800 resistance level.
Conversely, if the price fails to stay above the $10,400 support, it could extend its correction. The next key support is near the $10,200 level, plus the 1.236 Fib extension level of the upward move from the $10,296 low to $10,790 high. The main support is near the $10,000 level, which is also close to the 100 hourly simple moving average.
Looking at the chart, bitcoin price is trading with a positive bias above the $10,450 and $10,400 support levels. Even if there is an extended downside correction, the $10,200 level might act prevent declines. On the upside, the next set of resistance is near the $10,800 and $11,000 levels.
Technical indicators:
Hourly MACD – The MACD is currently placed in the bearish zone.
Hourly RSI (Relative Strength Index) – The RSI for BTC/USD is holding the 50 level, with a minor bearish angle.
Major Support Levels – $10,450 followed by $10,400.
Major Resistance Levels – $10,700, $10,800 and $11,000.


