
Reason to trust
How Our News is Made
Strict editorial policy that focuses on accuracy, relevance, and impartiality
Ad discliamer
Morbi pretium leo et nisl aliquam mollis. Quisque arcu lorem, ultricies quis pellentesque nec, ullamcorper eu odio.
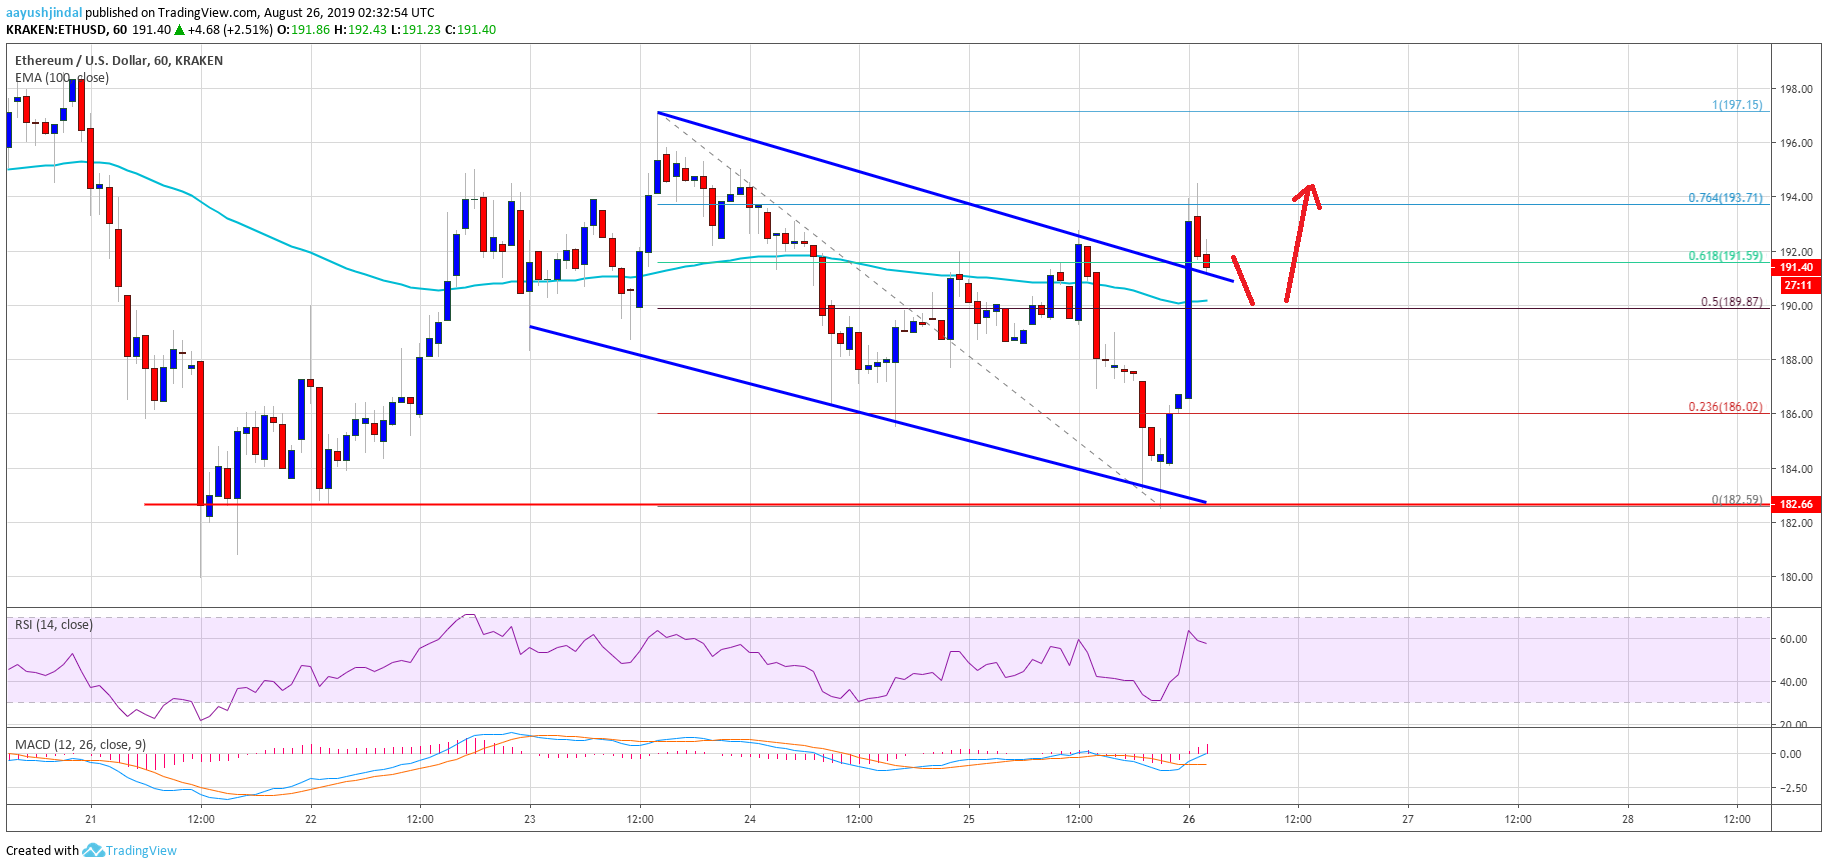
- ETH price is currently correcting higher and is trading above the $190 level against the US Dollar.
- The price is still trading well below the key $195 resistance area.
- There was a break above a major declining channel with resistance near $192 on the hourly chart of ETH/USD (data feed via Kraken).
- The pair is struggling to continue above $192 and $194, and it might decline again.
Ethereum price is facing a lot of selling interest versus the US Dollar and bitcoin. ETH remains at a risk of a fresh decline despite recent gains in BTC.
Ethereum Price Analysis
In the weekly forecast, as we a few important resistance for ETH price near the $192 and $195 levels against the US Dollar. The price formed a decent support near $182 recently and started an upside correction. The bulls gained traction above the $190 resistance level and the 100 hourly simple moving average. Moreover, bitcoin price jumped 5% recently and surged to test the $10,500 resistance level.
Ethereum price also climbed above the 50% Fib retracement level of the recent drop from the $197 high to $182 low. It opened the doors for more gains above the $192 level. Moreover, there was a break above a major declining channel with resistance near $192 on the hourly chart of ETH/USD. The pair tested the $194-195 resistance area, where the bulls struggled.
It seems like the price faced resistance near the 76.4% Fib retracement level of the recent drop from the $197 high to $182 low. At the moment, the price is trimming gains and is trading near the $192 level. An immediate support is near the $190 level and 100 hourly simple moving average. If the price fails to stay above the $190 support, it could decline back towards the $185 level.
On the upside, the main hurdles are near the $194 and $195 levels. A successful run above the $195 level might set the pace for a move towards the $200 and $202 resistance levels. As long as the price is below the $195 and $200 resistance levels, there is a risk of a fresh decrease in the coming sessions.
Looking at the chart, Ethereum price is facing many hurdles on the upside such as $194, $195, $200 and $202. On the downside, the $190 level is an immediate support. However, the main support is at $180, below which the bulls might struggle to bounce back in the near term.
ETH Technical Indicators
Hourly MACD – The MACD for ETH/USD is gaining momentum in the bullish zone.
Hourly RSI – The RSI for ETH/USD is currently placed nicely above the 50 level.
Major Support Level – $185
Major Resistance Level – $195


