
Reason to trust
How Our News is Made
Strict editorial policy that focuses on accuracy, relevance, and impartiality
Ad discliamer
Morbi pretium leo et nisl aliquam mollis. Quisque arcu lorem, ultricies quis pellentesque nec, ullamcorper eu odio.
- Ripple price started an upside correction after trading as low as $0.2580 against the US dollar.
- Bitcoin price is back above $10,000, but it is facing many important resistances near $10,250.
- Yesterday’s followed key declining channel with resistance near $0.2670 was breached on the hourly chart of the XRP/USD pair (data source from Kraken).
- The pair is now facing a strong resistance near the $0.2750 level and the 100 hourly SMA.
Ripple price is trading near a major resistance at $0.2750 against the US Dollar, similar to bitcoin. Therefore, XRP remains at a risk of more downsides below $0.2620 in the near term.
Ripple Price Analysis
Yesterday, we saw a major decline in XRP price below the $0.2800 and $0.2700 support levels against the US Dollar. Moreover, the price settled below $0.2700 and the 100 hourly simple moving average. Finally, the price broke the $0.2620 support and traded as low as $0.2581. Recently, ripple started an upside correction and traded above the $0.2620 and $0.2650 resistance levels.
Additionally, the price climbed above the 23.6% Fib retracement level of the last key decline from the $0.2919 high to $0.2581 low. More importantly, yesterday’s followed key declining channel with resistance near $0.2670 was breached on the hourly chart of the XRP/USD pair. The pair climbed above the $0.2700 level, but it faced a strong resistance near the $0.2750 level.
The 50% Fib retracement level of the last key decline from the $0.2919 high to $0.2581 low acted as a major resistance. Moreover, it seems like the 100 hourly simple moving average is preventing an upside break above $0.2750. If there is a successful close above $0.2750 and the 100 hourly SMA, the price could continue to rise in the coming sessions.
Conversely, if the bulls continue to struggle near $0.2750, the price might start a fresh decline. An immediate support is near the $0.2650 level. A downside break below the $0.2650 level might set the pace for more losses towards the $0.2600 and $0.2580 levels. Any further downsides could push the price towards the $0.2500 support level in the near term.
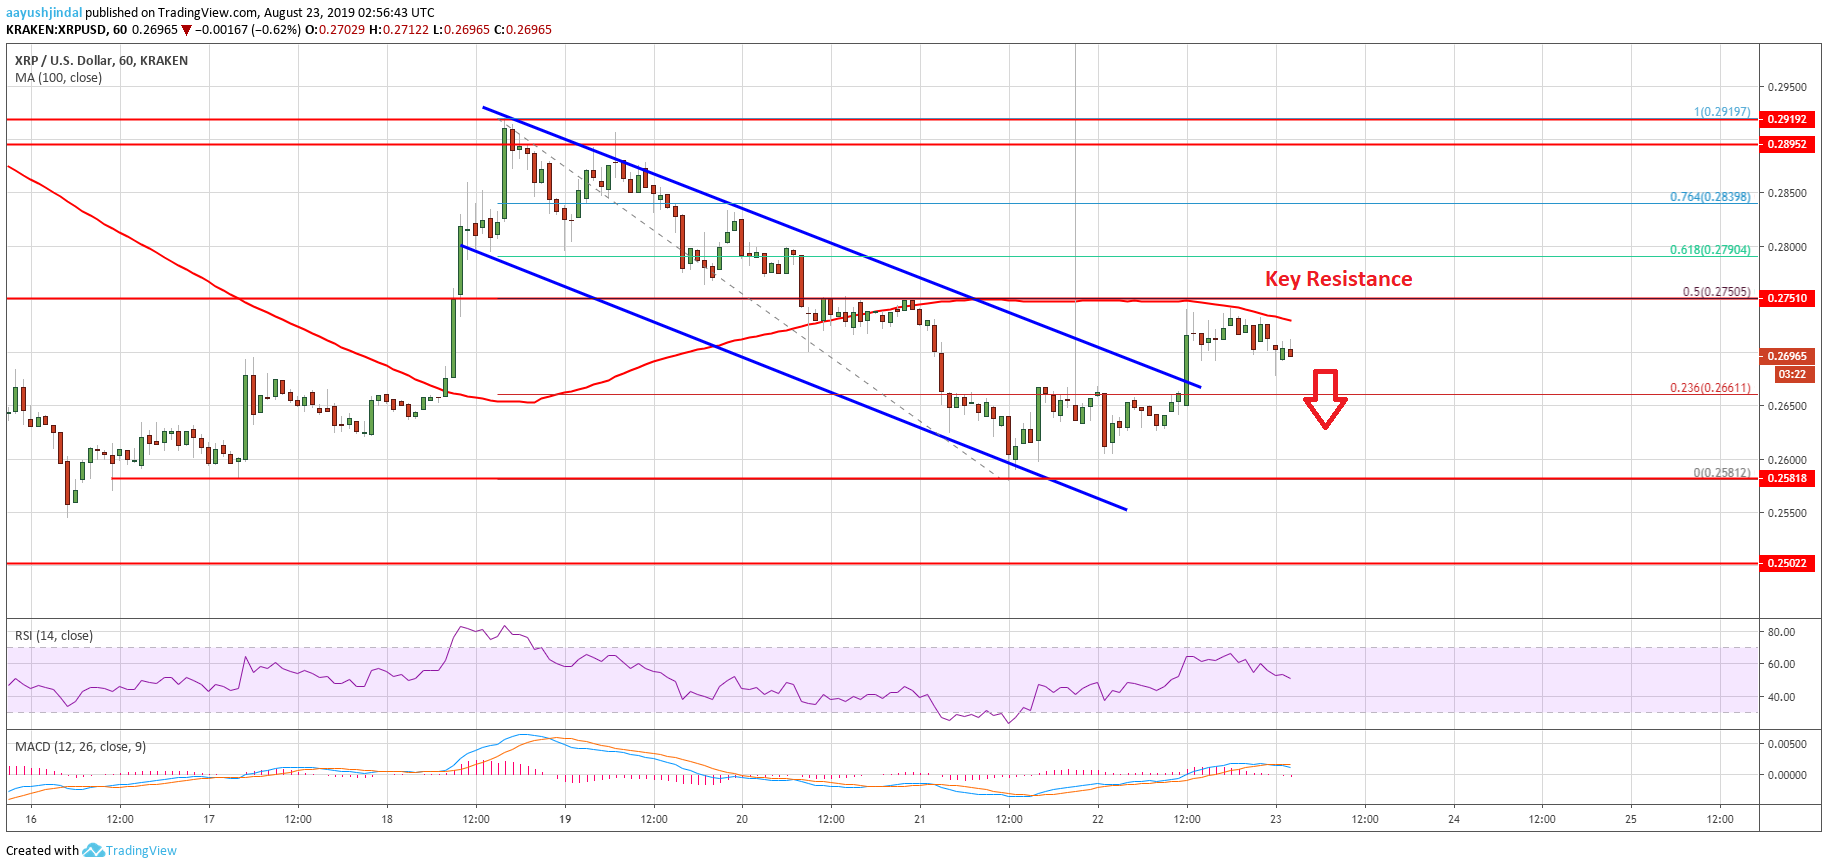
Looking at the chart, ripple price is clearly facing a strong resistance near the 100 hourly simple moving average and the $0.2750 level. Therefore, the bears may perhaps aim a fresh decline below the $0.2650 and $0.2600 levels. Only a successful close above $0.2750 might help the bulls in gaining strength.
Technical Indicators
Hourly MACD – The MACD for XRP/USD is slowly gaining pace in the bearish zone.
Hourly RSI (Relative Strength Index) – The RSI for XRP/USD is currently declining towards the 50 level.
Major Support Levels – $0.2650, $0.2600 and $0.2580.
Major Resistance Levels – $0.2750, $0.2840 and $0.2900.


