
Reason to trust
How Our News is Made
Strict editorial policy that focuses on accuracy, relevance, and impartiality
Ad discliamer
Morbi pretium leo et nisl aliquam mollis. Quisque arcu lorem, ultricies quis pellentesque nec, ullamcorper eu odio.
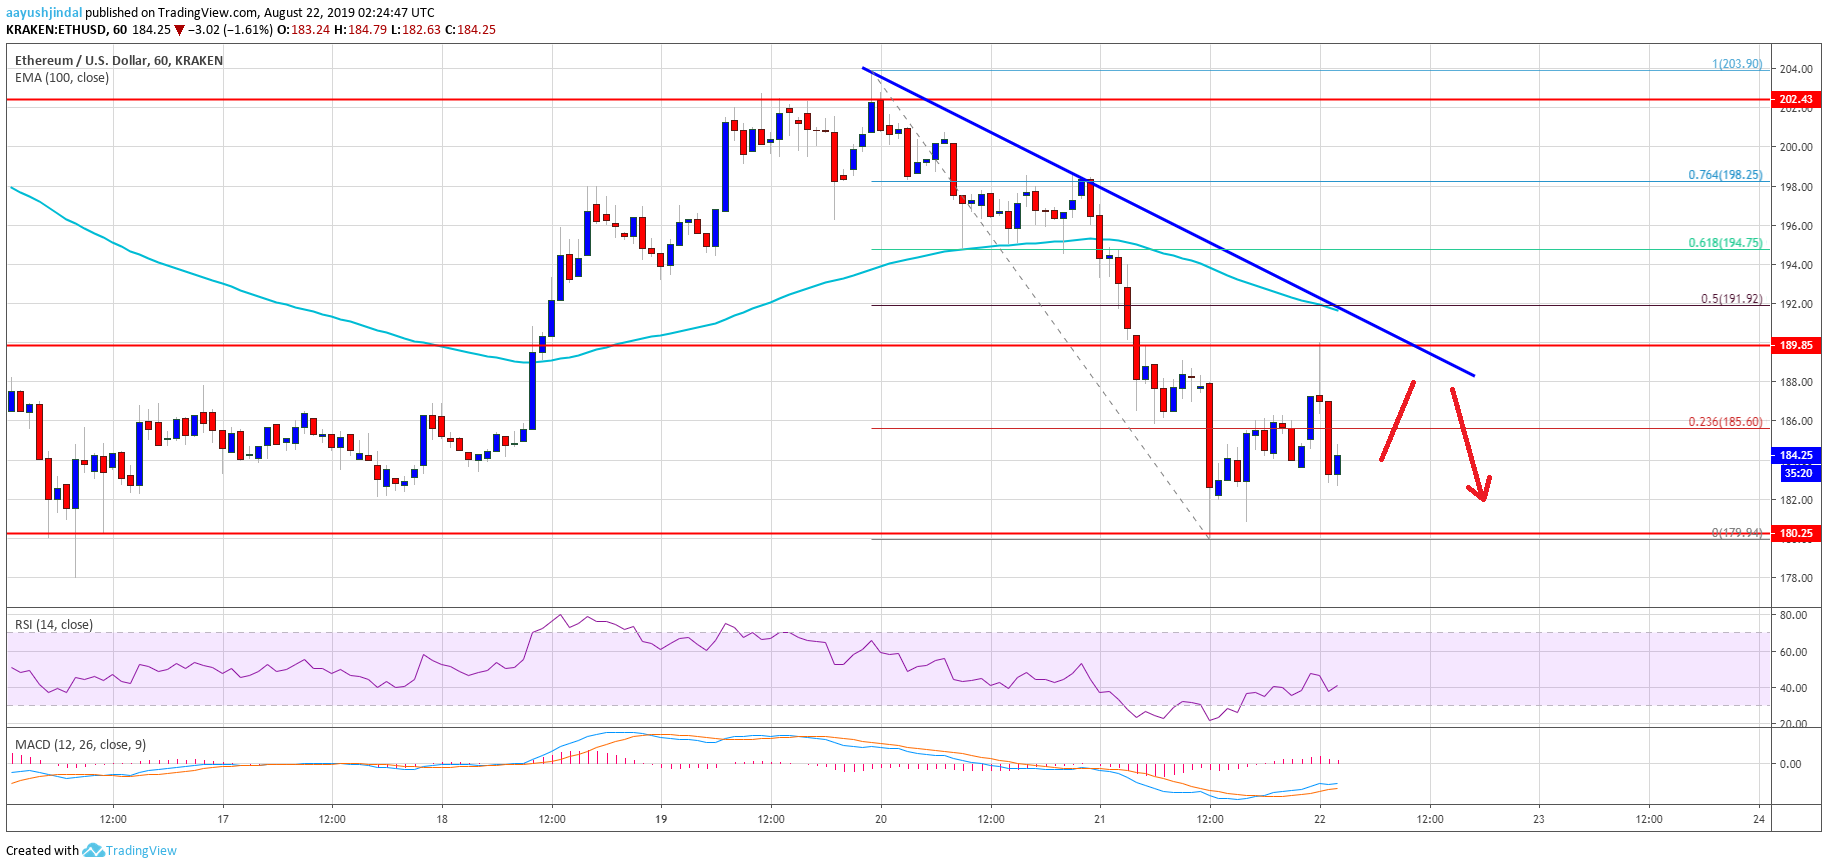
- ETH price started a fresh decrease after it failed to climb above the $202 resistance against the US Dollar.
- The price is down more than 8% from the high and it is now trading well below $190.
- There is a connecting bearish trend line forming with resistance near $190 on the hourly chart of ETH/USD (data feed via Kraken).
- The pair could correct higher, but upsides are likely to remain capped near the $190 resistance.
Ethereum price is trading in a bearish zone below $190 versus the US Dollar, and bitcoin declined 8%. ETH might correct a few points, but the bulls could struggle to gain traction.
Ethereum Price Analysis
After a strong rejection near the $200 and $202 resistance levels, ETH price declined heavily against the US Dollar. There were also bearish moves in bitcoin and ripple below $10,000 and $0.2800 respectively. It opened the doors for more losses and ETH declined below the key $190 support level. Moreover, there was a break below the $188 level plus a close below the 100 hourly simple moving average.
Ethereum price tested the $180 support level and recently corrected higher. There was a break above the $185 level plus the 23.6% Fib retracement level of the recent decline from the $203 high to $180 swing low. However, the upward move was capped by the $190 resistance. Moreover, the price failed to test the 50% Fib retracement level of the recent decline from the $203 high to $180 swing low.
There is also a connecting bearish trend line forming with resistance near $190 on the hourly chart of ETH/USD. The pair is now trading well below the $190 resistance and the 100 hourly SMA. On the downside, an immediate support is near the $180 level. If there is a bearish break below $180, Ethereum price is likely to accelerate its decline towards $175 and $172.
On the upside, the bulls are facing a strong resistance near the $190 zone. Therefore, a successful close above the $190 resistance and the 100 hourly SMA is needed for a fresh increase. The next immediate resistance is near the $195 level, followed by the main $202 resistance.
Looking at the chart, Ethereum price is clearly facing a lot of hurdles on the upside near the $190 and $192 levels. Therefore, there is a risk of more downsides below the $180 support level. Besides, if bitcoin slides further below $9,500, it could drag the crypto market lower.
ETH Technical Indicators
Hourly MACD – The MACD for ETH/USD is about to move back into the bearish zone.
Hourly RSI – The RSI for ETH/USD is currently near the 50 level.
Major Support Level – $180
Major Resistance Level – $190


