
Reason to trust
How Our News is Made
Strict editorial policy that focuses on accuracy, relevance, and impartiality
Ad discliamer
Morbi pretium leo et nisl aliquam mollis. Quisque arcu lorem, ultricies quis pellentesque nec, ullamcorper eu odio.
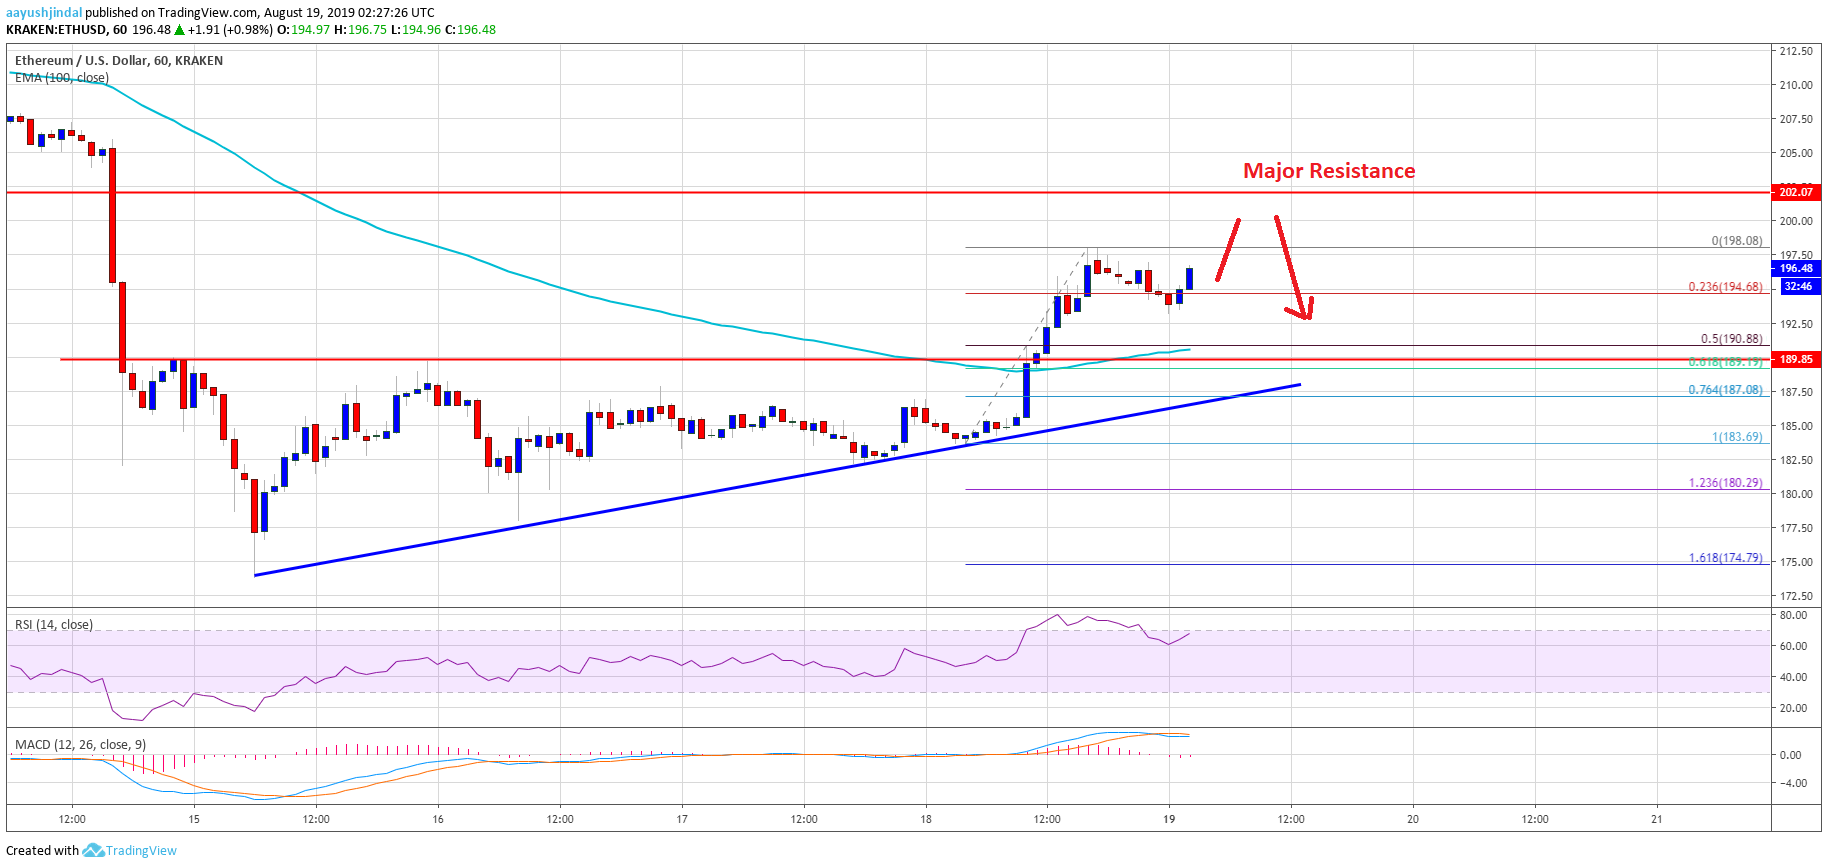
- ETH price recovered recently and managed to climb above the $190 resistance against the US Dollar.
- The price is now trading nicely above the $190 and $192 resistance levels.
- There is a connecting bullish trend line forming with support near $188 on the hourly chart of ETH/USD (data feed via Kraken).
- The pair is likely to continue higher, but the $202 resistance is likely to cap the upside.
Ethereum price is climbing higher towards key resistances versus the US Dollar, similar to bitcoin. ETH price is likely to face a strong selling interest near the $200 level.
Ethereum Price Analysis
This past week, we saw a major drop in ETH price below the $202 support area against the US Dollar. The decline was such that the price even broke the $184 support area. Finally, it traded to a new monthly low at $174 and recently started an upside correction. Besides, there was a decent recovery noted in bitcoin price as well above the $10,200 resistance level.
Ethereum price recovered above the key $190 resistance level and the 100 hourly simple moving average. Moreover, there was a break above the $192 and $195 resistance levels. It tested the $198 level and is currently consolidating gains. It tested the 23.6% Fib retracement level of the upward move from the $184 swing low to $198 high. On the downside, there is a strong support forming near the $190 level and the 100 hourly SMA.
Moreover, there is a connecting bullish trend line forming with support near $188 on the hourly chart of ETH/USD. The $190 support also coincides with the 50% Fib retracement level of the upward move from the $184 swing low to $198 high. Therefore, dips towards the $190 support area might find buyers in the short term. If there is a downside break below $190 and $188, the price could resume its decline.
On the upside, there is a strong resistance area near the $200 and $202 levels. Therefore,. if there is an upside break above the $202 resistance, the price is likely to continue higher towards the $210 and $215 levels.
Looking at the chart, Ethereum price is clearly correcting higher and is trading nicely above the $192 level. Having said that, the $202 resistance area holds the key. If the price fails to surpass the $202 barrier, there could be a fresh decline. The main supports on the downside are near the $190 and $188 levels.
ETH Technical Indicators
Hourly MACD – The MACD for ETH/USD is slowly moving into the bearish zone.
Hourly RSI – The RSI for ETH/USD is currently placed nicely above the 60 level.
Major Support Level – $190
Major Resistance Level – $202


