
Reason to trust
How Our News is Made
Strict editorial policy that focuses on accuracy, relevance, and impartiality
Ad discliamer
Morbi pretium leo et nisl aliquam mollis. Quisque arcu lorem, ultricies quis pellentesque nec, ullamcorper eu odio.
- Ripple price declined sharply after it broke the key $0.2900 support area against the US dollar.
- The price is down more than 10% and even tumbled to test the $0.2350 level.
- A short term breakout pattern is forming with resistance near $0.2685 on the hourly chart of the XRP/USD pair (data source from Kraken).
- The pair is likely to accelerate its decline once it breaks the $0.2580 and $0.2500 support levels.
Ripple price is down and out against the US Dollar and bitcoin. XRP price is now trading in a crucial downtrend, with chances of more downsides towards the $0.2400 level.
Ripple Price Analysis
Yesterday, we saw bearish moves in bitcoin, but ripple price remained stable above $0.2900 against the US Dollar. However, the XRP/USD pair failed to hold the $0.2920 and $0.2900 support levels. As a result, there was a sharp decline below the $0.2800 and $0.2720 support levels. The price declined more than 15% in the past few sessions and spiked sharply below $0.2500. A new swing low was formed near $0.2350 and the price recently corrected higher.
It broke the $0.2500 level plus the 50% Fib retracement level of the recent drop from the $0.2975 high to $0.2336 low. However, the price is facing a lot of hurdles on the upside near the $0.2700 level. At the outset, there is a short term breakout pattern is forming with resistance near $0.2685 on the hourly chart of the XRP/USD pair. Above the triangle resistance, the next resistance is near the $0.2740 level.
Moreover, the 61.8% Fib retracement level of the recent drop from the $0.2975 high to $0.2336 low is near the $0.2730 level. If there is a break above the $0.2750 resistance, the price could recover towards the $0.2850 and $0.2900 resistance levels (the previous supports).
Conversely, if there is a downside break below the $0.2550 support, the price could accelerate losses. The next support is near the $0.2500 level, below which there is a risk of a sharp drop towards the $0.2350 swing low. If there are more downside, the next stop for the bears could be $0.2200.
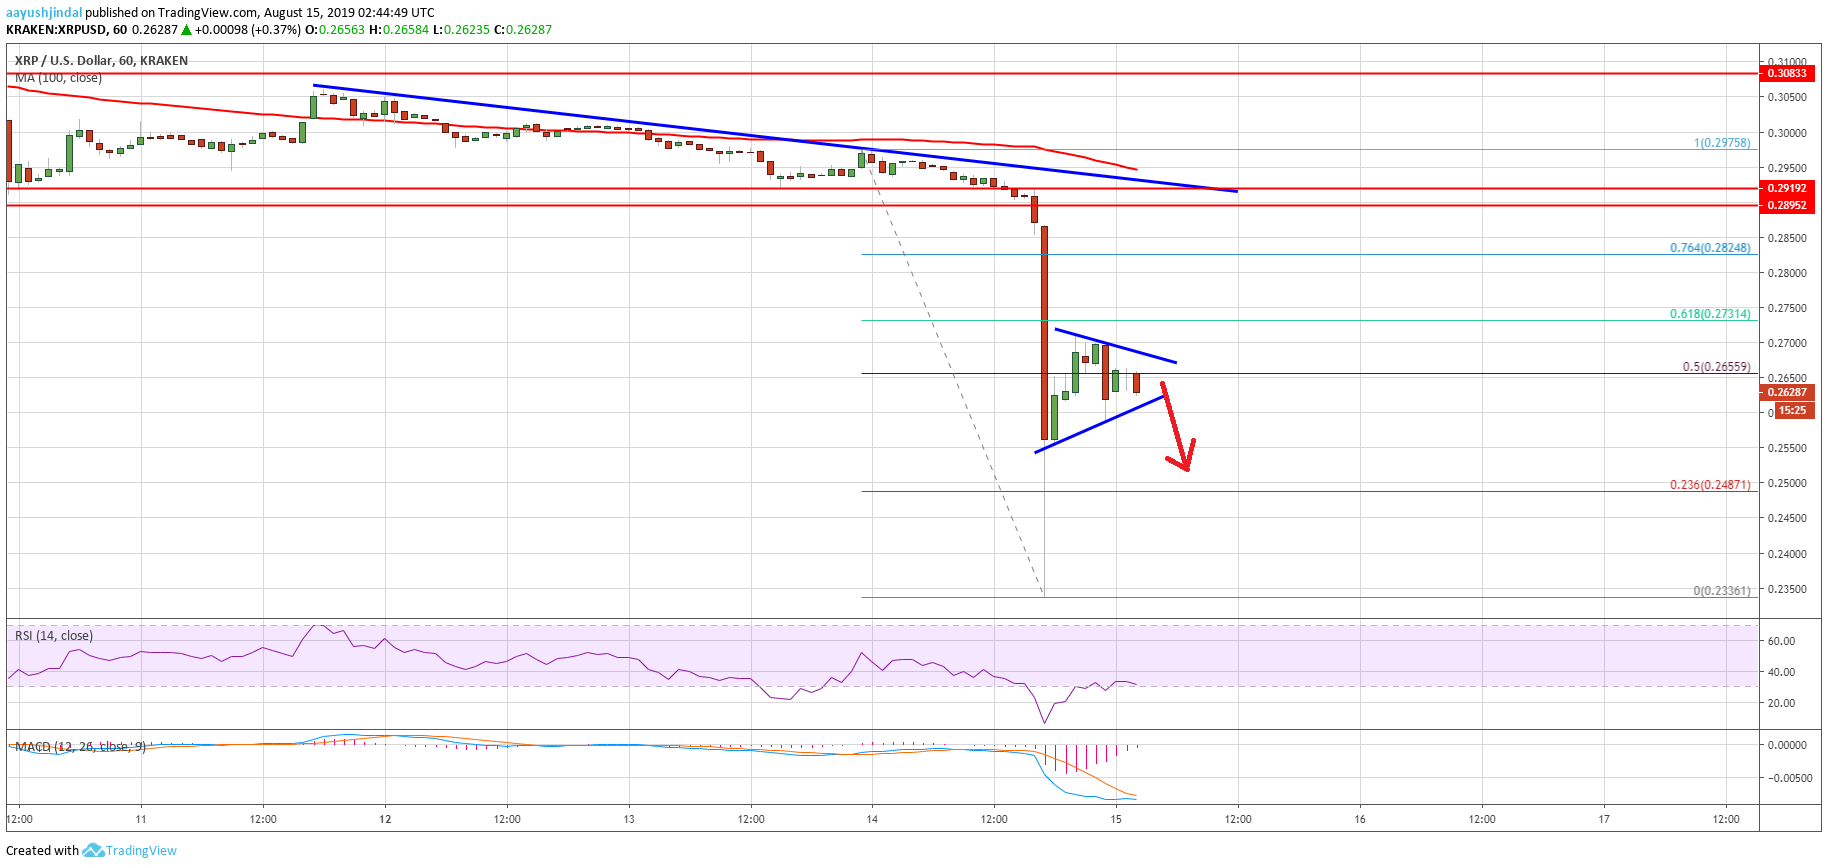
Looking at the chart, ripple price is clearly trading in a bearish zone below the $0.2750 resistance. The current price action indicates more downsides below the $0.2550 and $0.2500 levels. It would be interesting to see how the bulls react if the price reaches the $0.2400 support area.
Technical Indicators
Hourly MACD – The MACD for XRP/USD is slowly reducing its bearish slope.
Hourly RSI (Relative Strength Index) – The RSI for XRP/USD is recovering above the 30 level.
Major Support Levels – $0.2550, $0.2500 and $0.2400.
Major Resistance Levels – $0.2700, $0.2750 and $0.2850.


