
Reason to trust
How Our News is Made
Strict editorial policy that focuses on accuracy, relevance, and impartiality
Ad discliamer
Morbi pretium leo et nisl aliquam mollis. Quisque arcu lorem, ultricies quis pellentesque nec, ullamcorper eu odio.
- After a decent rise, bitcoin price topped near the $12,325 level against the US Dollar.
- The price is currently correcting lower below $11,500, with a bearish angle.
- There was a break below a crucial contracting triangle with support near $11,750 on the 4-hours chart of the BTC/USD pair (data feed from Kraken).
- The pair is currently holding the $11,200 support, but it could extend its decline to $10,500.
Bitcoin price is currently correcting gains from $12,325 against the US Dollar. BTC price could correct lower towards $10,500 before it could rise again in the near term.
Bitcoin Price Weekly Analysis (BTC)
In the past few days, there was a decent rise in bitcoin price above the $11,000 resistance against the US Dollar. The BTC/USD pair traded above the $11,500 and $11,800 resistance levels. Moreover, there was a break above $12,000 and the price settled well above the 100 simple moving average (4-hours). A swing high was formed near $12,325 before the price started a downside correction.
There was a consolidation pattern formed below $12,000 before the price started a downside correction. Moreover, there was a break below a crucial contracting triangle with support near $11,750 on the 4-hours chart of the BTC/USD pair. The pair declined below the $11,500 support plus the 23.6% Fib retracement level of the last upward move from the $9,147 low to $12,325 high.
It opened the doors for more losses and the price declined below the $11,400 level. Bitcoin price is now trading above the $11,200 support level and is consolidating losses. If there are more downsides, the price could test the $11,000 or $10,900 support level. The next key support is near the $10,740 level. It represents the 50% Fib retracement level of the last upward move from the $9,147 low to $12,325 high.
However, the main support is near the $10,500 level and the 100 simple moving average (4-hours). The final stop for the bears could be the $10,350 level. It coincides with the 61.8% Fib retracement level of the last upward move from the $9,147 low to $12,325 high. On the upside, an immediate resistance is near the $11,500 level.
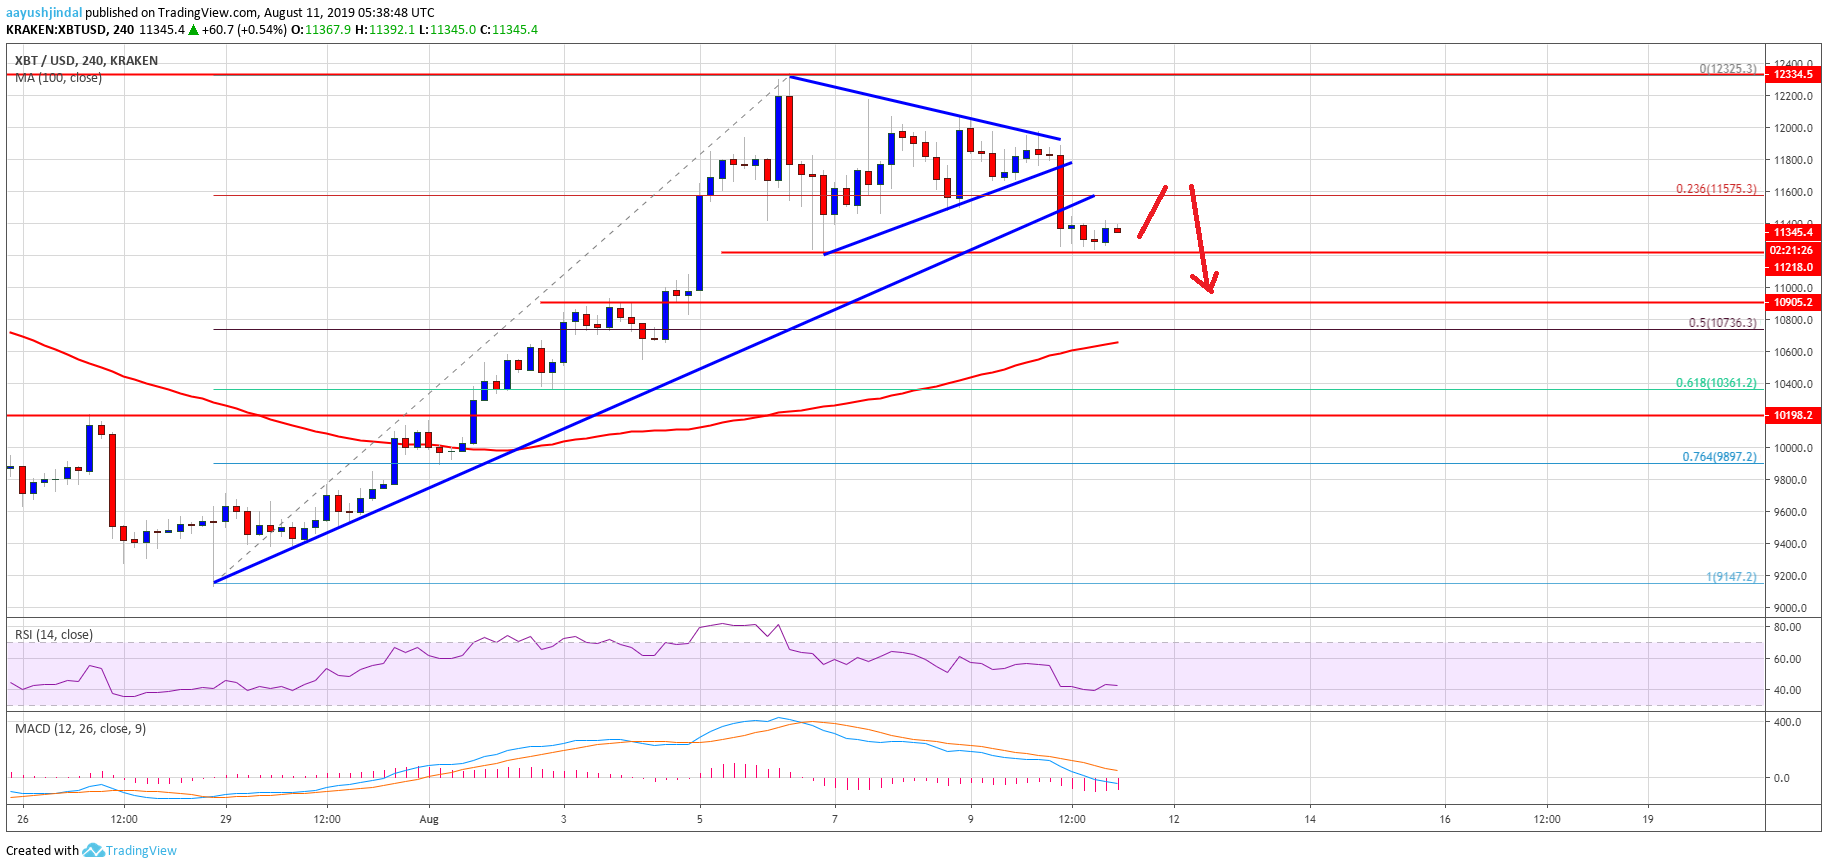
Looking at the chart, bitcoin price is clearly correcting gains from the $12,325 high. It might continue to slide towards the $10,500 or $10,400 support. On the other hand, a successful break above $11,500 and a follow through above $11,800 is needed for more gains in the near term.
Technical indicators
4 hours MACD – The MACD for BTC/USD is gaining momentum in the bullish zone.
4 hours RSI (Relative Strength Index) – The RSI for BTC/USD is currently holding the 40 level.
Major Support Level – $11,000
Major Resistance Level – $11,800


