
Reason to trust
How Our News is Made
Strict editorial policy that focuses on accuracy, relevance, and impartiality
Ad discliamer
Morbi pretium leo et nisl aliquam mollis. Quisque arcu lorem, ultricies quis pellentesque nec, ullamcorper eu odio.
- Bitcoin price is trading above a couple of important supports near $11,800 against the US Dollar.
- The price could rally sharply if there is a successful close above the $12,000 resistance.
- There was a break above a major contracting triangle with resistance near $11,860 on the hourly chart of the BTC/USD pair (data feed from Kraken).
- The price is showing positive signs, suggesting high chances of an upside break above the $12,000 level.
Bitcoin price is struggling to clear the key $12,000 resistance against the US Dollar. However, BTC price could climb higher as long as it is above the $11,500 support.
Bitcoin Price Analysis
Recently, there was a minor downside correction in bitcoin price from the $12,000 resistance against the US Dollar. The BTC/USD pair traded below the $11,800 support. Moreover, there was a break below $11,650 and the 100 hourly simple moving average. However, the price found a strong buying interest near the $11,500 support area. A swing low was formed near $11,495 and the price recently climbed higher.
There was a break above the $11,800 resistance and the 100 hourly SMA. Moreover, there was a break above a major contracting triangle with resistance near $11,860 on the hourly chart of the BTC/USD pair. The pair even cleared the $12,000 resistance, but it failed to continue higher. A swing high was formed near $12,077 and the price is currently correcting gains.
It traded below $12,000 plus the 23.6% Fib retracement level of the recent wave from the $11,495 low to $12,077 high. However, there is a strong support forming near the $11,750 level and the 100 hourly SMA. The 50% Fib retracement level of the recent wave from the $11,495 low to $12,077 high is also a decent support near the $11,786 level.
Besides, the broken triangle zone could act as a support near $11,750. The main support on the downside is near the $11,500 level, below which the price could turn bearish in the near term. On the upside, there is a cluster of resistances near the $12,000 and $12,100 levels. Therefore, a successful close above $12,000 is needed for a sustained upward move.
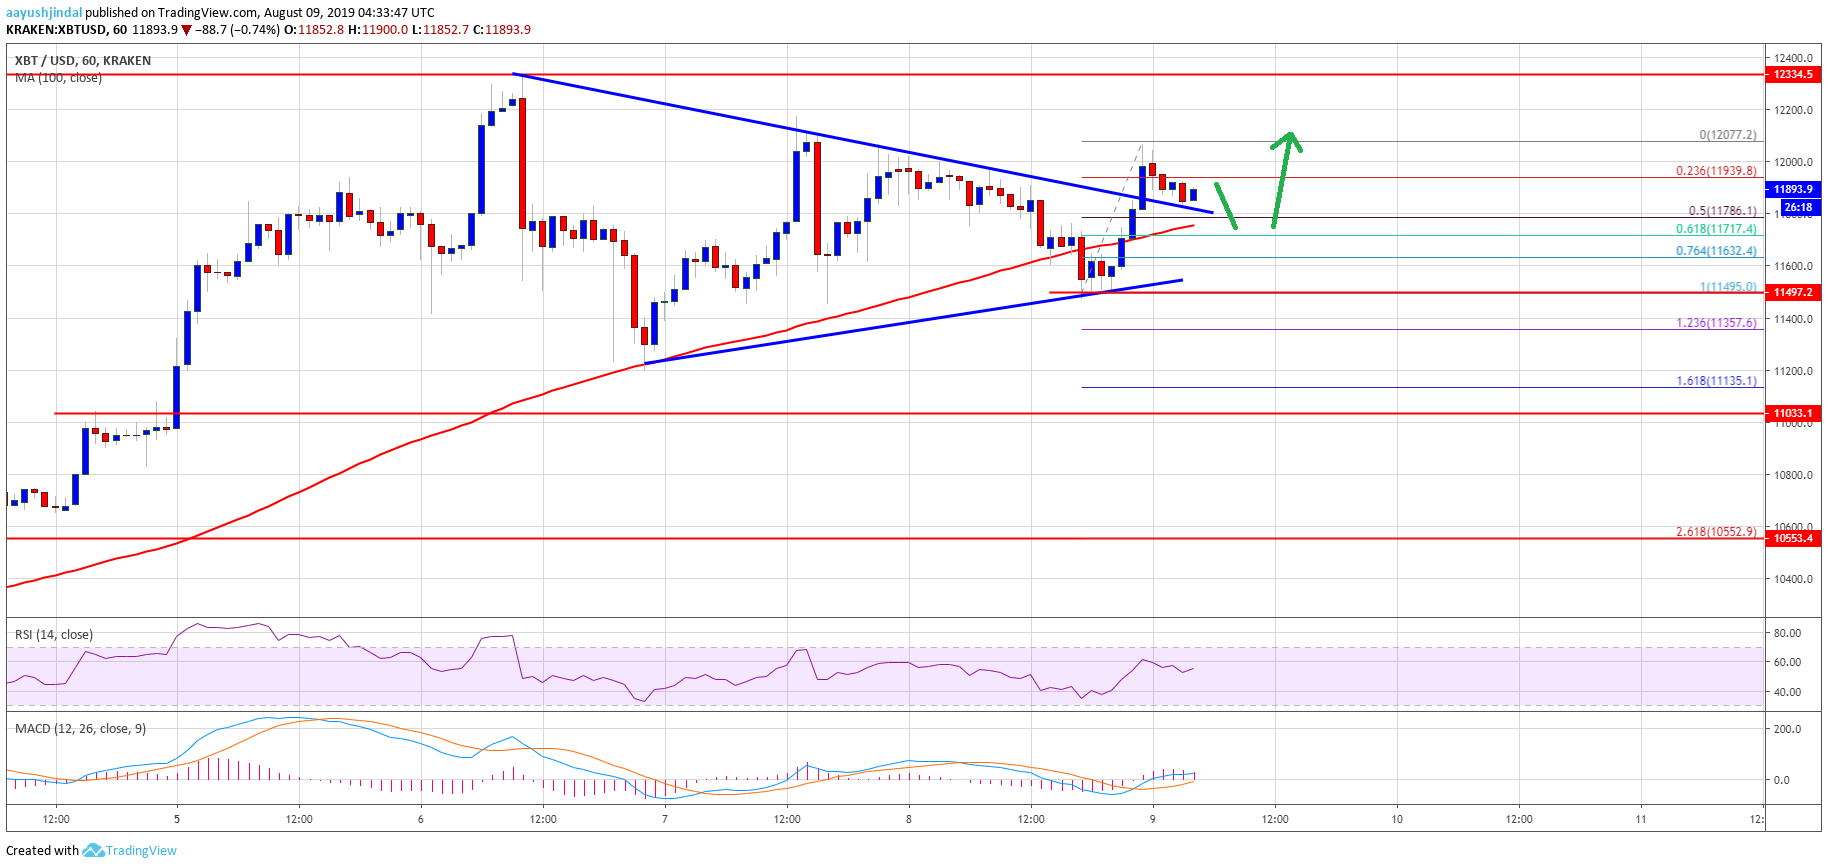
Looking at the chart, bitcoin price is holding a couple of important supports near $11,750 and $11,700. Having said that, the price will only turn bearish in the short term if there is a daily close below $11,500. On the upside, the bulls could target $12,300 and $12,500.
Technical indicators:
Hourly MACD – The MACD is currently showing negative signs in the bullish zone.
Hourly RSI (Relative Strength Index) – The RSI for BTC/USD is currently placed nicely above the 50 level.
Major Support Levels – $11,750 followed by $11,500.
Major Resistance Levels – $12,000, $12,100 and $12,200.


