
Reason to trust
How Our News is Made
Strict editorial policy that focuses on accuracy, relevance, and impartiality
Ad discliamer
Morbi pretium leo et nisl aliquam mollis. Quisque arcu lorem, ultricies quis pellentesque nec, ullamcorper eu odio.
- ETH price gained bullish momentum and broke the $220 resistance level against the US Dollar.
- The price even climbed above the $225 resistance and tested the $230 zone.
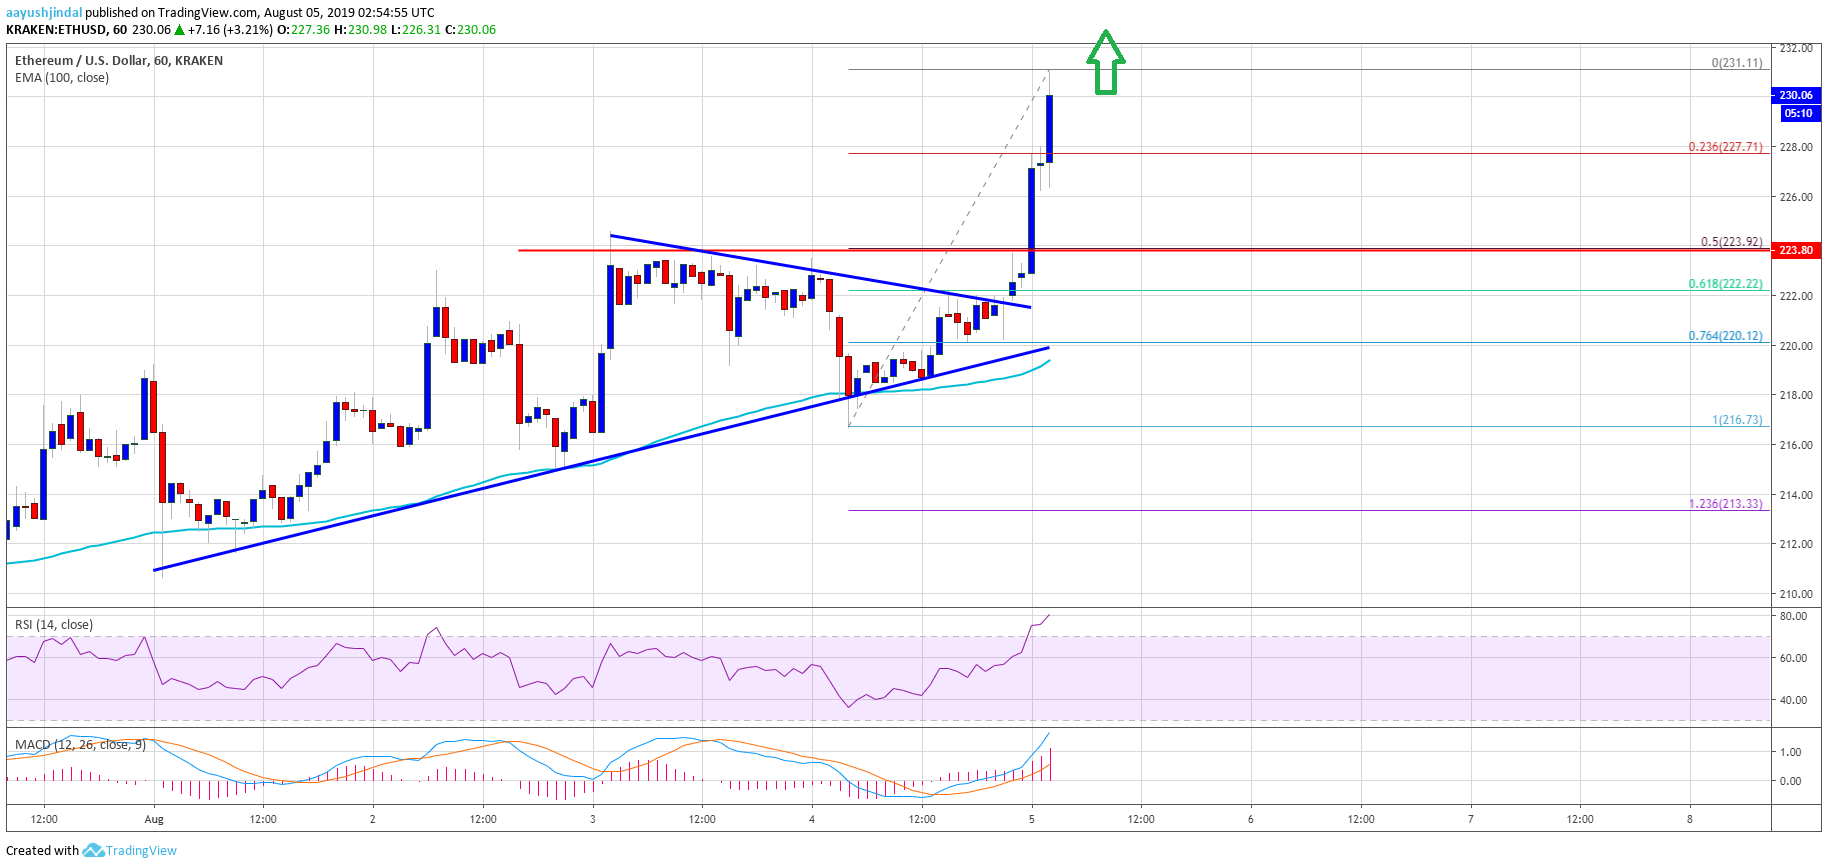
- There was a break above a major bearish trend line with resistance near $221 on the hourly chart of ETH/USD (data feed via Kraken).
- The pair is gaining momentum above the $225 resistance and it could climb towards the $240 level.
Ethereum price is showing a lot of positive signs above $225 versus the US Dollar, while bitcoin rallied 8%. ETH price might continue to climb towards the $240 and $250 levels.
Ethereum Price Analysis
In the past few sessions, there were bullish moves in Ethereum price above $220 against the US Dollar. The ETH/USD pair formed a swing low near the $216 level and recently started a strong upward move. The pair climbed above the key $220 resistance level to start an uptrend. More importantly, bitcoin price rallied above $11,200 (as discussed in the weekly forecast).
During the rise, there was a break above a major bearish trend line with resistance near $221 on the hourly chart of ETH/USD. The pair even cleared the $225 resistance and settled well above the 100 hourly simple moving average. A swing high is formed near $231 and the price is clearly gaining strength. An immediate support is near the $227 level. The 23.6% Fib retracement level of the recent rally from the $216 low to $230 high is also near the $227 level.
However, the main support is near the $224 level. The 50% Fib retracement level of the recent rally from the $216 low to $230 high is also near the $227 level is also near the $224 level. Moreover, the $224-$225 zone represents the previous resistance zone. Therefore, the $224 zone is likely to act as a strong support in the near term.
On the upside, a clear break above the $232 level might start a push towards the $240 zone. If the bulls remain in action, there are chances of an upside break towards the $250 level in the coming sessions.
Looking at the chart, Ethereum price is clearly gaining strength above the $225 level. Therefore, there are high chances of a solid rise towards the $240 and $250 resistance levels. Conversely, if there is a downside correction, the price is likely to find a lot of buying interest near the $224 level.
ETH Technical Indicators
Hourly MACD – The MACD for ETH/USD is gaining momentum in the bullish zone.
Hourly RSI – The RSI for ETH/USD is currently well above the 70 level and in the overbought zone.
Major Support Level – $224
Major Resistance Level – $232


