
Reason to trust
How Our News is Made
Strict editorial policy that focuses on accuracy, relevance, and impartiality
Ad discliamer
Morbi pretium leo et nisl aliquam mollis. Quisque arcu lorem, ultricies quis pellentesque nec, ullamcorper eu odio.
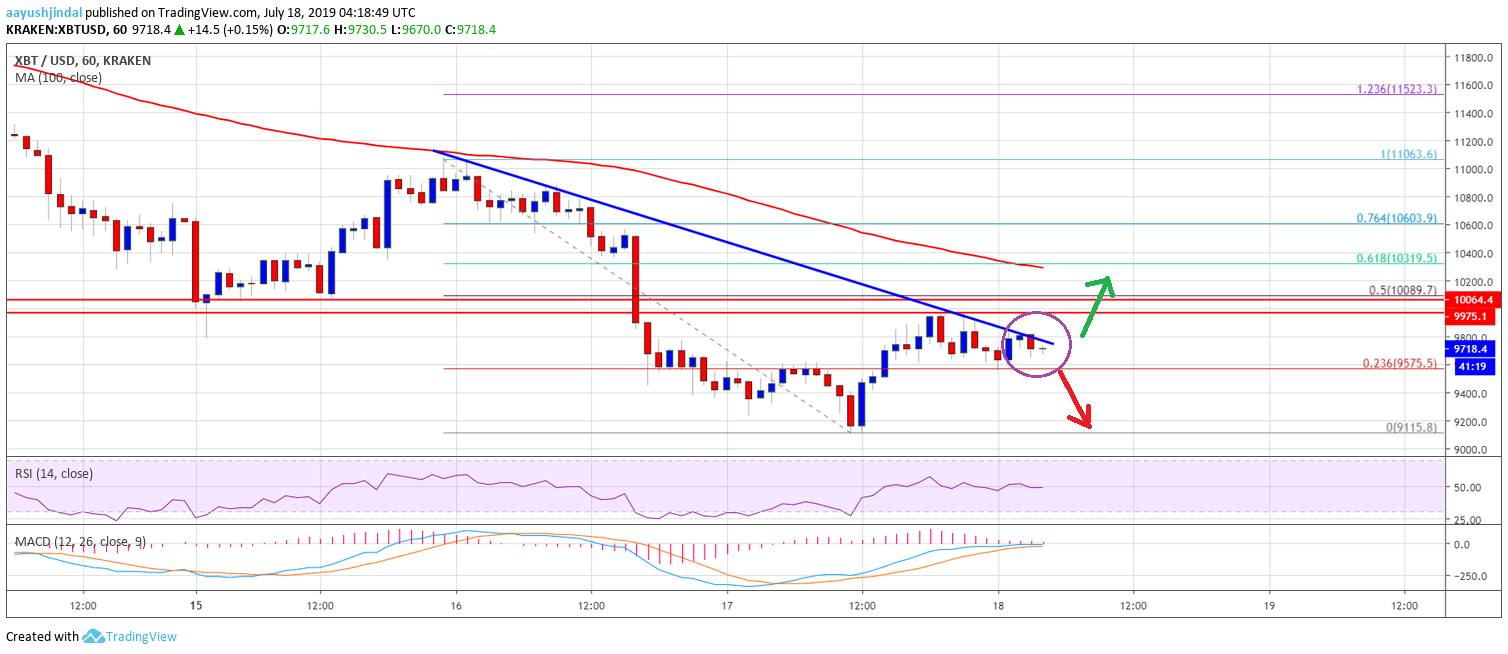
- Bitcoin price declined heavily and traded below the $10,000 and $9,500 levels against the US Dollar.
- The price traded close to the $9,100 level and recently started an upside correction.
- Yesterday’s highlighted key bearish trend line is still active with resistance near $9,740 on the hourly chart of the BTC/USD pair (data feed from Kraken).
- The price is likely to face a strong resistance near the $9,900 and $10,000 resistances in the near term.
Bitcoin price extended losses towards the $9,100 level against the US Dollar. BTC is currently correcting higher, but the bulls may struggle to clear the $10,000 resistance.
Bitcoin Price Analysis
Yesterday, we saw another strong drop in bitcoin price below the $10,000 support against the US Dollar. The BTC/USD pair even broke the $9,800 and $9,500 support levels. Similarly, there were losses in Ethereum and ripple before both found support. BTC traded close to the $9,100 level and recently found support near the $9,115 level. It is currently correcting higher and moved above the $9,400 resistance level.
Moreover, there was a break above the 23.6% Fib retracement level of the last decline from the $11,065 swing high to $9,115 low. However, the price struggled to surpass the $9,800 resistance level. Moreover, yesterday’s highlighted key bearish trend line is still active with resistance near $9,740 on the hourly chart of the BTC/USD pair. Besides, the price remained well below the 100 hourly simple moving average plus $10,000.
Above the trend line, there is a major hurdle forming near $10.000. The 50% Fib retracement level of the last decline from the $11,065 swing high to $9,115 low is just above the $10,000 mark to act as a major hurdle. The next important resistance is near the $10,300 level, the 100 hourly SMA, and the 61.8% Fib retracement level of the last decline from the $11,065 swing high to $9,115 low.
Therefore, an upside break above the $10,000 and $10,100 resistance levels won’t be easy in the near term. If the price fails to settle above $10,000 and gain momentum above $10,300, then there could be a fresh decrease.
Looking at the chart, bitcoin price is facing an uphill task near the $9,800 and $10,000 levels. If the bulls continue to struggle, the price might move down below $9,600 and $9,500. The main supports are near $9,200 and $9,100.
Technical indicators:
Hourly MACD – The MACD is about to move back in the bearish zone.
Hourly RSI (Relative Strength Index) – The RSI for BTC/USD is move above the 50 level, with a positive bias.
Major Support Levels – $9,500 followed by $9,200.
Major Resistance Levels – $9,80, $9,900 and $10,000.


