
Reason to trust
How Our News is Made
Strict editorial policy that focuses on accuracy, relevance, and impartiality
Ad discliamer
Morbi pretium leo et nisl aliquam mollis. Quisque arcu lorem, ultricies quis pellentesque nec, ullamcorper eu odio.
- A decent support base is formed by bitcoin price above the $11,000 level against the US Dollar.
- The price is facing a few key resistances near the $11,500 and $11,600 levels.
- There is a major contracting triangle forming with resistance near $11,475 on the hourly chart of the BTC/USD pair (data feed from Kraken).
- It seems like the bulls are preparing for an upside break above the $11,500 resistance area.
Bitcoin price is slowly gaining bullish momentum above $11,200 against the US Dollar. BTC could rise sharply once it settles above $11,500 in the near term.
Bitcoin Price Analysis
After forming a support base near $10,800, bitcoin price recovered steadily against the US Dollar. The BTC/USD pair traded above the $11,000 and $11,200 resistance levels to move into a positive zone. The upward move was steady above the $11,400 level and the 100 hourly simple moving average. Moreover, the price traded above the $11,500 resistance level, but it struggled to gain pace above $11,600.
A swing high was formed near $11,624 and recently the price corrected lower. It broke the $11,500 level and the 100 hourly SMA. Moreover, there was a spike below $11,400 plus the 23.6% Fib retracement level of the last wave from the $10,995 low to $11,624 high. However, the price found support near the $11,350 level. The 50% Fib retracement level of the last wave from the $10,995 low to $11,624 high also provided support.
At the outset, there is a major contracting triangle forming with resistance near $11,475 on the hourly chart of the BTC/USD pair. If bitcoin price climbs above the $11,500 resistance, it could start a decent upward move. The price may perhaps gather bullish momentum once it clears the recent high near $11,624. On the upside, the next key resistance is near the $12,000 level, above which the price could test the $12,400 level.
Conversely, if there is no upside break, the price may test the triangle support near $11,200. If there is a downside break below the $11,200 support, the price might decline sharply towards the next major support near $10,800.
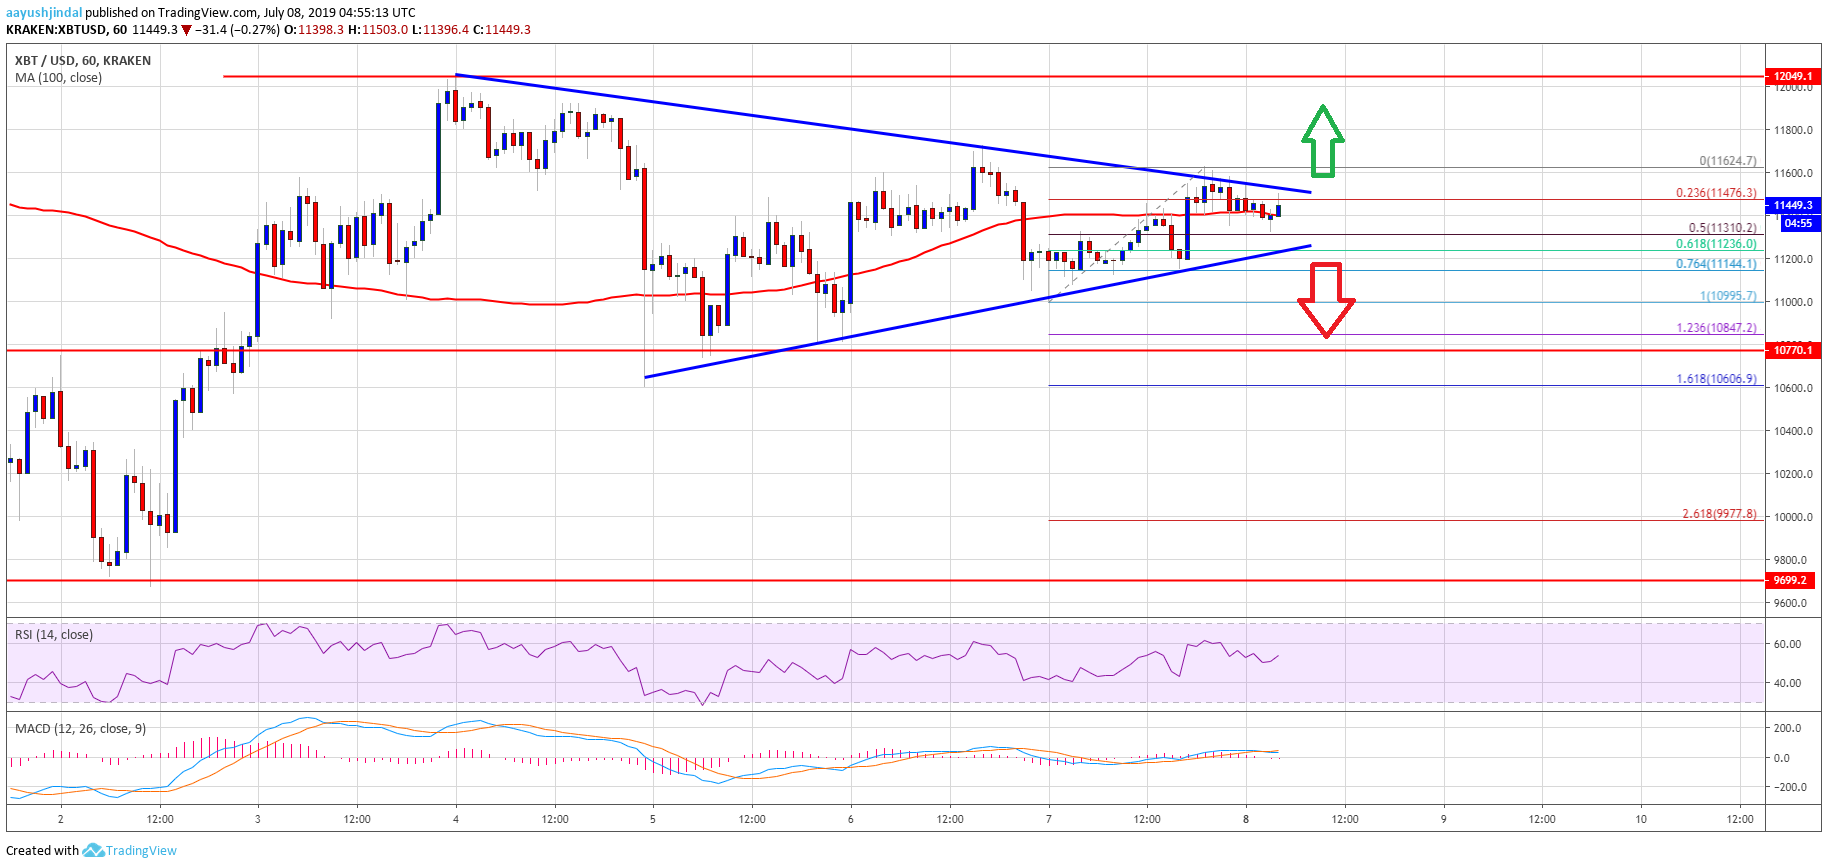
Looking at the chart, bitcoin price is clearly preparing for the next major move either above $11,500 or towards $10,800. If there is a successful close above $11,500 and $11,650, the bulls are likely to take control and push the price towards the $12,000 and $12,400 levels in the coming days.
Technical indicators:
Hourly MACD – The MACD is slowly gaining pace in the bullish zone.
Hourly RSI (Relative Strength Index) – The RSI for BTC/USD is currently above the 50 level, with a positive angle.
Major Support Levels – $11,200 followed by $11,000.
Major Resistance Levels – $11,500, $11,600 and $12,000.


