
Reason to trust
How Our News is Made
Strict editorial policy that focuses on accuracy, relevance, and impartiality
Ad discliamer
Morbi pretium leo et nisl aliquam mollis. Quisque arcu lorem, ultricies quis pellentesque nec, ullamcorper eu odio.
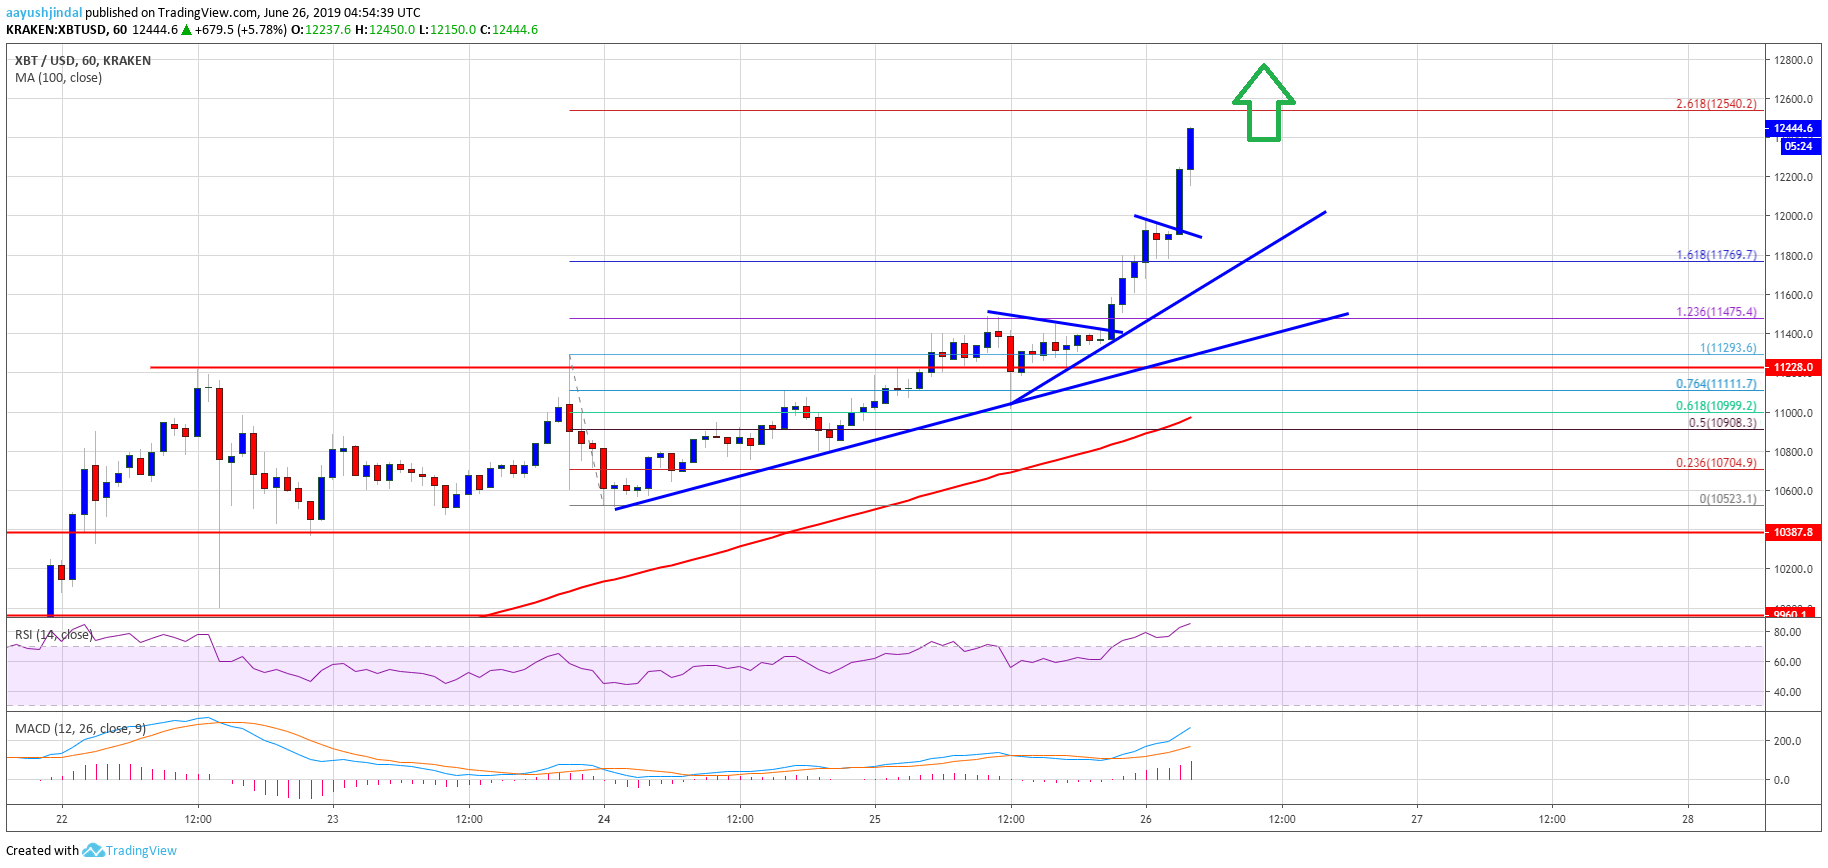
- There was a sharp increase in bitcoin price above the $11,800 and $12,000 resistances against the US Dollar.
- The price surged above $12,200 and even traded to a new 2019 high near $12,500.
- There are two key bullish trend lines forming with support near $12,000 and $11,450 on the hourly chart of the BTC/USD pair (data feed from Kraken).
- The pair remains in a strong uptrend and it could even climb above $12,550 and $12,750.
Bitcoin price surged above the main $12,000 resistance against the US Dollar. BTC price is currently gaining momentum and it could even trade towards the $13,000 level.
Bitcoin Price Analysis
This week, we discussed the $12,000 level as a possible target for bitcoin against the US Dollar. The BTC/USD pair did remain in a positive zone and recently broke a few important resistances near $11,500 and $11,800. As a result, there was an upside break above $12,000 level and the price traded to our weekly target. The recent wave was such that the price even surged above $12,200 and traded to a new 2019 high near $12,500.
It is now trading well above the 1.236 Fib extension level of the last decline from the $11,295 swing high to $10,525 low. During the rise, the price broke a few important bullish continuation patterns near $11,400 and $12,000. It seems like the price is rallying towards the next possible target near the $12,540 level. It coincides with the 1.618 Fib extension level of the last decline from the $11,295 swing high to $10,525 low.
On the downside, there are many supports near the $12,200 and $12,000 levels. Moreover, there are two key bullish trend lines forming with support near $12,000 and $11,450 on the hourly chart of the BTC/USD pair. Additionally, the main support on the downside is near the $11,225, where the bulls are likely to defend any further losses.
On the upside, if the price breaks the $12,540 resistance, there could be a sharp upward move. Therefore, the next target for the bulls could be near the $13,000 level. If there are more gains, the price may even accelerate towards the $13,500 level in the near term.
Looking at the chart, bitcoin price is gaining a lot of strength above the $12,000 level. The price action is super strong and there seems no reason for a major pullback in the near term. Therefore, there could be more gains above the $12,500 and $12,800 levels.
Technical indicators:
Hourly MACD – The MACD is currently gaining strength in the bullish zone.
Hourly RSI (Relative Strength Index) – The RSI for BTC/USD is now above the 70 level and is in the overbought zone.
Major Support Levels – $12,200 followed by $12,000.
Major Resistance Levels – $12,500, $12,800 and $13,000.


