
Reason to trust
How Our News is Made
Strict editorial policy that focuses on accuracy, relevance, and impartiality
Ad discliamer
Morbi pretium leo et nisl aliquam mollis. Quisque arcu lorem, ultricies quis pellentesque nec, ullamcorper eu odio.
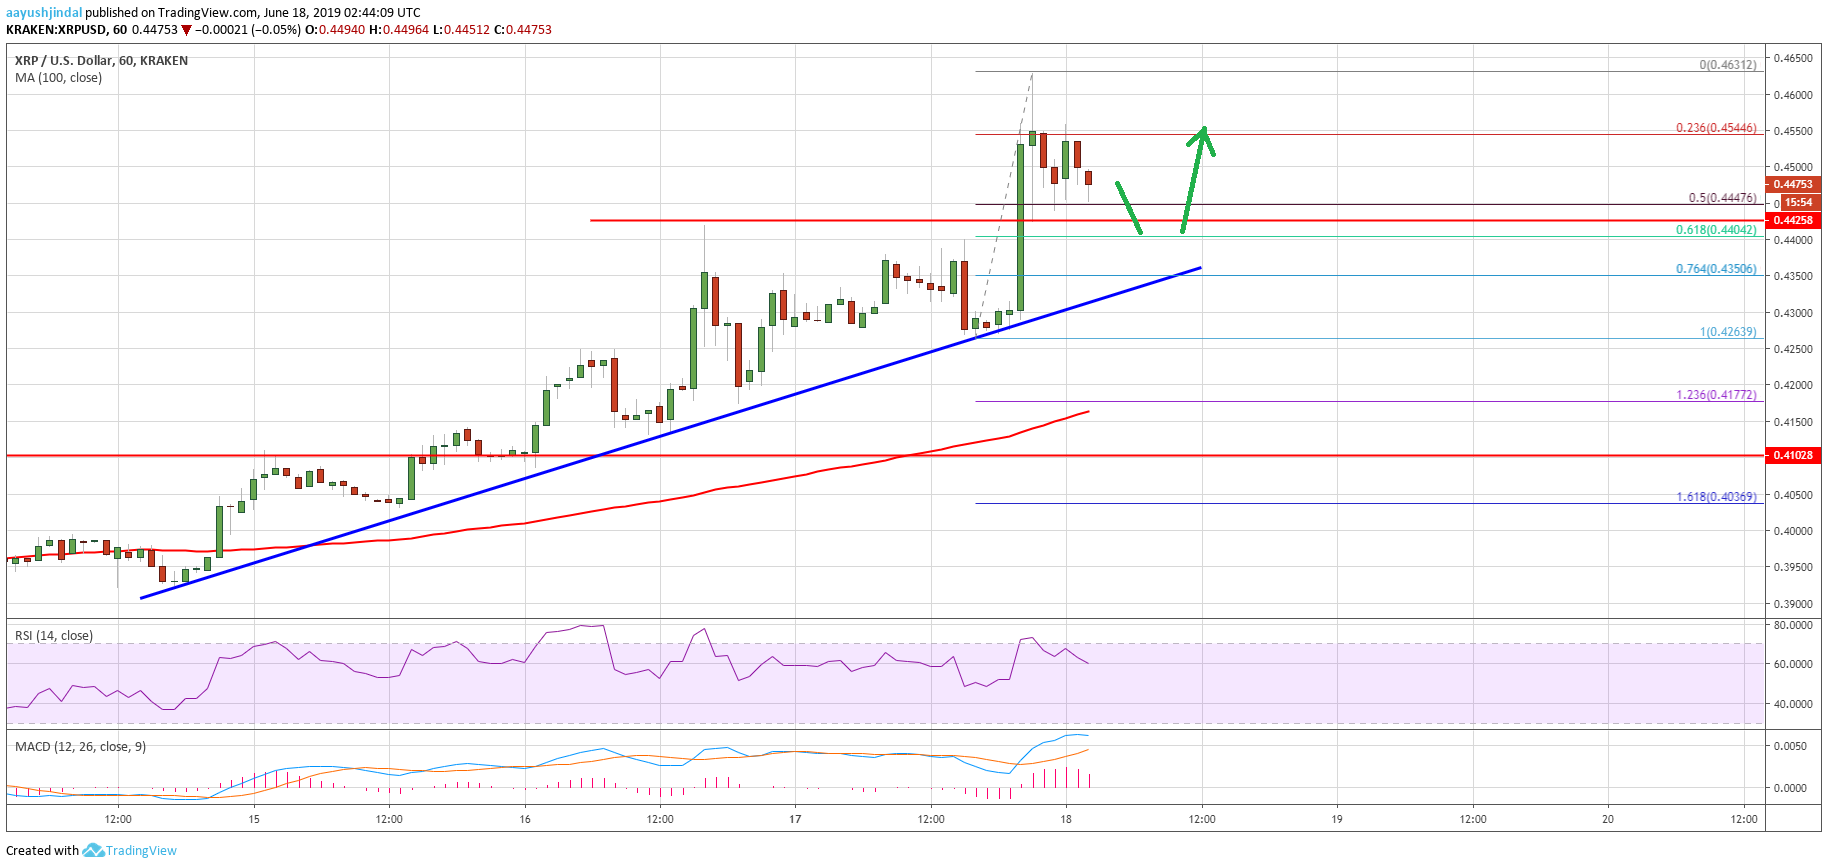
- Ripple price climbed higher sharply and broke the key $0.4500 resistance area against the US dollar.
- The price traded to a new monthly high at $0.4631 and recently started a downside correction.
- Yesterday’s highlighted major bullish trend line is intact with support near $0.4360 on the hourly chart of the XRP/USD pair (data source from Kraken).
- The pair remains well bid on the downside and it is likely to climb higher above $0.4600 and $0.4620.
Ripple price gained a strong momentum against the US Dollar and bitcoin. XRP is currently correcting gains, but it is likely to start a fresh increase above $0.4600 in the near term.
Ripple Price Analysis
Yesterday, we discussed the chances of ripple price surpassing the $0.4500 resistance against the US Dollar. The XRP/USD pair did gain momentum in the past three sessions and rallied above the $0.4450 and $0.4500 resistance levels. There was even a break above the $0.4600 level and the price traded to a new monthly high at $0.4631. Recently, it started a downside correction below $0.4600, but it remained well above the 100 hourly simple moving average.
There was a break below the $0.4550 level and the 23.6% Fib retracement level of the recent rally from the $0.4263 low to $0.4631 high. The price even traded below the $0.4500 support, but the $0.4450 level acted as a strong support. It seems like the previous hurdles near $0.4440 and $0.4450 are acting as supports. Moreover, the 50% Fib retracement level of the recent rally from the $0.4263 low to $0.4631 high is acting as a support.
More importantly, yesterday’s highlighted major bullish trend line is intact with support near $0.4360 on the hourly chart of the XRP/USD pair. There could be further downsides, but the $0.4400 and $0.4360 levels are likely to hold losses.
On the upside, an initial resistance is near the $0.4550 level. If the price starts a fresh increase above $0.4550, it is likely to climb back above $0.4600 and $0.4620. The next important resistance levels are $0.4650 and $0.4700. If the bulls remain in action, the price might target the $0.5000 level in the coming sessions.
Looking at the chart, ripple price is clearly trading with a strong bullish bias above $0.4200 and $0.4350. Therefore, there are chances of more gains above $0.4550 and $0.4600. Only a close below $0.4200 could negate the current bullish view.
Technical Indicators
Hourly MACD – The MACD for XRP/USD is still placed nicely in the bullish zone.
Hourly RSI (Relative Strength Index) – The RSI for XRP/USD is currently correcting lower from 70 towards 60 and 55.
Major Support Levels – $0.4400, $0.4360 and $0.4300.
Major Resistance Levels – $0.4550, $0.4600 and $0.4650.


