
Reason to trust
How Our News is Made
Strict editorial policy that focuses on accuracy, relevance, and impartiality
Ad discliamer
Morbi pretium leo et nisl aliquam mollis. Quisque arcu lorem, ultricies quis pellentesque nec, ullamcorper eu odio.
- Ripple price started a short term recovery from the $0.3686 swing low against the US dollar.
- The price traded above the $0.4000 level, but it failed to surpass the $0.4050 resistance.
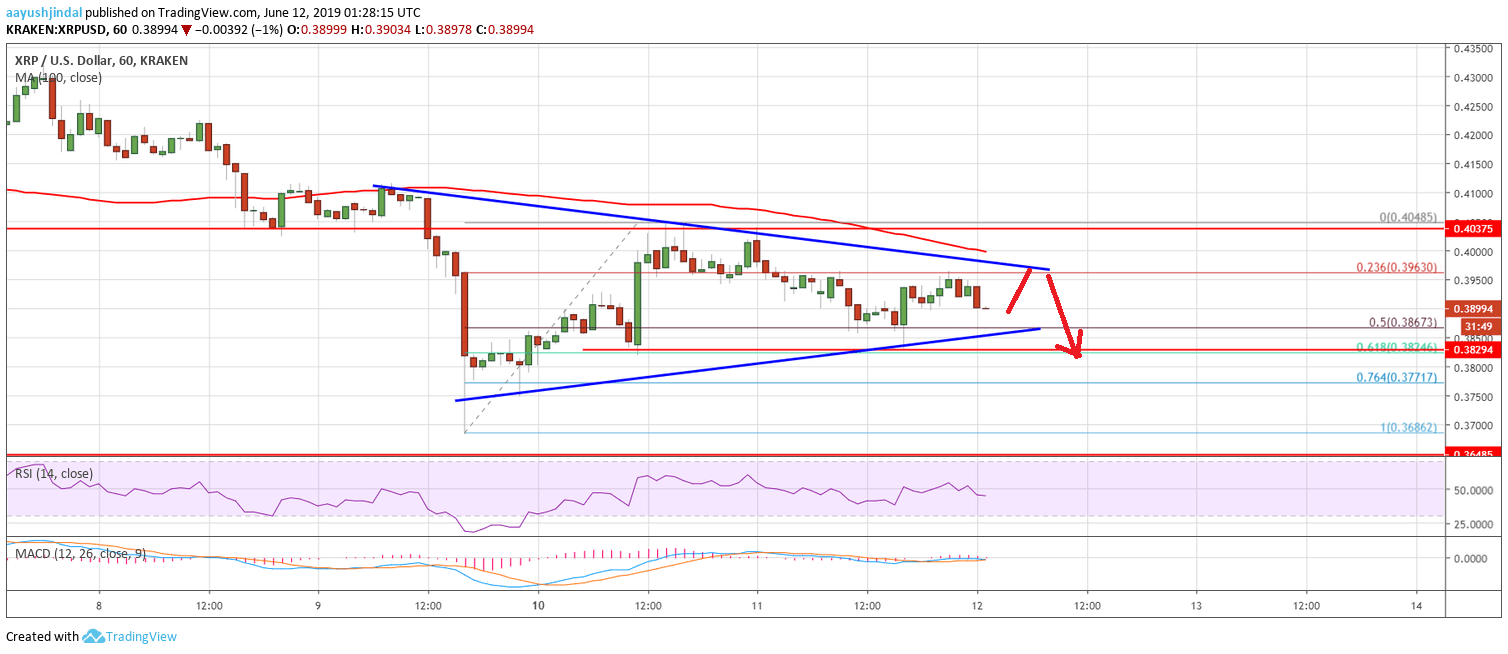
- There is a key contracting triangle forming with resistance near $0.3960 on the hourly chart of the XRP/USD pair (data source from Kraken).
- The pair could either break the $0.4050 resistance or decline again below the $0.3800 level.
Ripple price is currently consolidating in a range against the US Dollar, similar to bitcoin. XRP must break the $0.4000 and $0.4050 resistance levels to continue higher in the near term.
Ripple Price Analysis
After a major decline, ripple price found support near the $0.3680 area against the US Dollar. The XRP/USD pair traded as low as $0.3686 and recently started an upside correction. There was a break above the $0.3800 and $0.3900 resistance levels. The price even broke the $0.4000 level, but the $0.4050 level acted as a strong resistance. A swing high is formed near $0.4048 and the price is currently well below the 100 hourly simple moving average.
There was a downward move below the $0.4000 level and the 23.6% Fib retracement level of the recent wave from the $0.3686 swing low to $0.4048 high. Ripple price even broke the $0.3900 level and spiked towards $0.3800. It seems like the 50% Fib retracement level of the recent wave from the $0.3686 swing low to $0.4048 high is currently acting as a support. Moreover, there is a key contracting triangle forming with resistance near $0.3960 on the hourly chart of the XRP/USD pair.
On the upside, the triangle resistance, $0.4000, and the 100 hourly SMA holds the key. A successful close above the 100 hourly SMA could trigger more gains. If there is a follow through above $0.4050, the price is likely to accelerate above the $0.4100 level. The next stop for the bulls could be $0.4220. Conversely, if there is a downside break below $0.3850 and 61.8% Fib retracement level of the recent wave from the $0.3686 swing low to $0.4048 high, then there could be more losses.
Looking at the chart, ripple price is currently consolidating below $0.4000 and $0.4050. The bulls need to gain pace above $0.4050 to start a fresh increase. If they continue to fail, the price is likely to move down below $0.3850 and $0.3800 in the near term.
Technical Indicators
Hourly MACD – The MACD for XRP/USD is slowly moving back in the bearish zone.
Hourly RSI (Relative Strength Index) – The RSI for XRP/USD is now below the 50 level, with a bearish angle.
Major Support Levels – $0.3850, $0.3820 and $0.3700.
Major Resistance Levels – $0.3960, $0.4000 and $0.4050.


