
Reason to trust
How Our News is Made
Strict editorial policy that focuses on accuracy, relevance, and impartiality
Ad discliamer
Morbi pretium leo et nisl aliquam mollis. Quisque arcu lorem, ultricies quis pellentesque nec, ullamcorper eu odio.
- Bitcoin price started a fresh upward move after trading as low as $7,519 against the US Dollar.
- The price gained pace above the $7,700 resistance and even traded above $7,800.
- Yesterday’s highlighted key bearish trend line was breached with resistance near $7,780 on the hourly chart of the BTC/USD pair (data feed from Kraken).
- The pair is showing positive signs above the $7,800 support and the 100 hourly simple moving average.
Bitcoin price started a strong rebound above $7,700 and $7,800 against the US Dollar. However, BTC must gain pace above the $8,000 barrier to move into a positive zone.
Bitcoin Price Analysis
Recently, bitcoin price traded to a new weekly swing low close to $7,500 against the US Dollar. The BTC/USD pair found support near $7,500 and recently started a decent upward move. It broke the $7,600 and $7,700 resistance levels to start a recovery. There was a break above the 50% Fib retracement level of the key drop from the $8,130 high to $7,515 swing low. It opened the doors for more gains above the $7,800 level and the 100 hourly simple moving average.
Moreover, yesterday’s highlighted key bearish trend line was breached with resistance near $7,780 on the hourly chart of the BTC/USD pair. The pair even spiked above the $8,000 level, but it failed to gain bullish momentum above the $8,050 level. A swing high was formed near $8,080 and the price is currently consolidating gain. An initial support is near the 23.6% Fib retracement level of the recent wave from the $7,519 swing low to $8,080 high. Besides, there is a short term contracting triangle forming with resistance near $8,050. If there is an upside break, the price could continue to rise in the near term.
Conversely, if there is a downside break below $7,900, the price could test the $7,850 support area. The 100 hourly SMA is also just above $7,850 to act as a support. The next support is close to the $7,800 level. It represents the 50% Fib retracement level of the recent wave from the $7,519 swing low to $8,080 high.
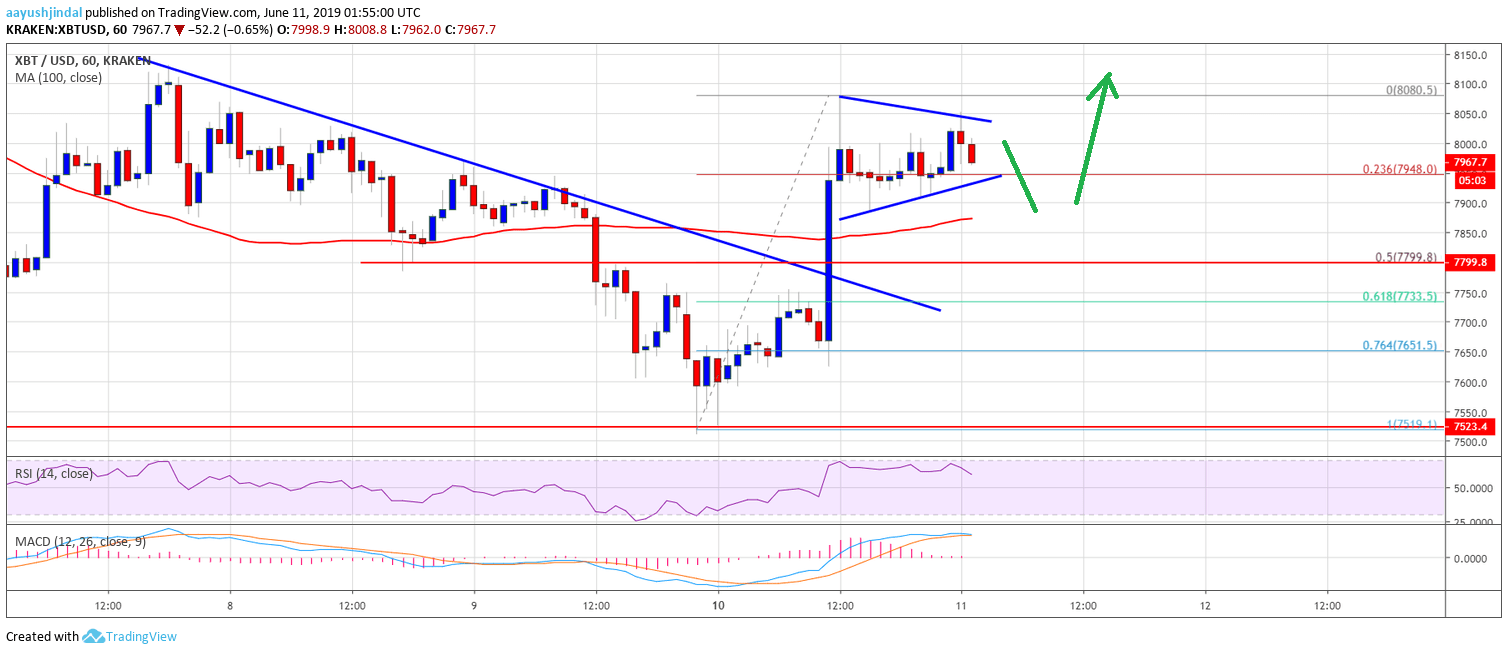
Looking at the chart, bitcoin price is trading with a positive bias above the $7,850 and $7,800. As long as there is no downside break below $7,800, the price might continue to rise. On the upside, a follow through above $8,000 and $8,080 might push the price towards $8,300.
Technical indicators:
Hourly MACD – The MACD is losing momentum in the bullish zone.
Hourly RSI (Relative Strength Index) – The RSI for BTC/USD is currently moving lower towards the 50 level.
Major Support Levels – $7,850 followed by $7,800.
Major Resistance Levels – $8,000, $8,080 and $8,200.


