
Reason to trust
How Our News is Made
Strict editorial policy that focuses on accuracy, relevance, and impartiality
Ad discliamer
Morbi pretium leo et nisl aliquam mollis. Quisque arcu lorem, ultricies quis pellentesque nec, ullamcorper eu odio.
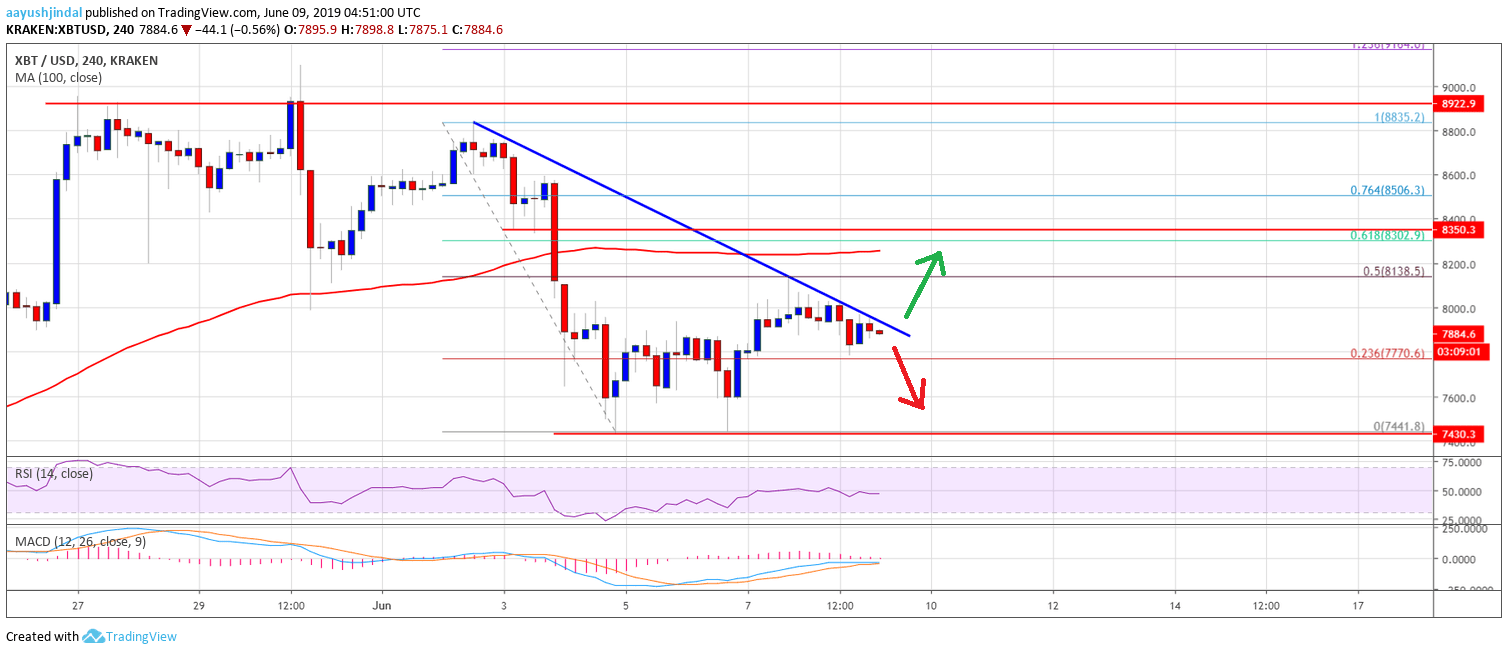
- The recent recovery in bitcoin price faced a strong resistance near the $8,140 level against the US Dollar.
- The price is currently facing a strong resistance and it is likely to struggle near $8,000.
- There is a major bearish trend line forming with resistance near $7,950 on the 4-hours chart of the BTC/USD pair (data feed from Kraken).
- The pair could either break the $8,000 resistance and rally or decline below the $7,700 support area.
Bitcoin price is showing signs of weakness below the $8,000 barrier against the US Dollar. BTC could make the next move either above $8,000 or below $7,700 in the coming sessions.
Bitcoin Price Weekly Analysis (BTC)
This past week, bitcoin price started a short term recovery after trading below $7,600 against the US Dollar. The BTC/USD pair traded as low as $7,441 and settled below the 100 simple moving average (4-hours). Recently, it recovered above the $7,700 and $7,800 resistance levels. There was a break above the 23.6% Fib retracement level of the recent decline from the $8,835 high to $7,441 swing low.
However, the upward move faced a strong resistance near the $8,000 and $8,150 levels. The price also faced a strong resistance near the 50% Fib retracement level of the recent decline from the $8,835 high to $7,441 swing low. There is also a major bearish trend line forming with resistance near $7,950 on the 4-hours chart of the BTC/USD pair. If there is an upside break above the trend line, the price could recover further above $8,150. The next key resistance is near the $8,300 level and the 100 simple moving average (4-hours).
The 61.8% Fib retracement level of the recent decline from the $8,835 high to $7,441 swing low is also near the $8,300 level to act as a hurdle for the bulls. If they surpass $8,300, the price could rally towards the $8,500 level. Conversely, if the price fails to move above the trend line and $8,000, there could be a downside break. On the downside, an immediate support is near the $7,700 level, below which there is a risk of more losses in the near term. The next key support is at $7,600, below which the price could even clear the $7,440 swing low.
Looking at the chart, bitcoin price seems to be trading near an important area at $8,000. If there is an upside break, the price could start a strong uptrend. If not, there is a risk of a fresh decline below the $7,700 and $7,500 support levels.
Technical indicators
4 hours MACD – The MACD for BTC/USD is slowly moving in the bearish zone.
4 hours RSI (Relative Strength Index) – The RSI for BTC/USD is currently near the level 50, with a flat bias.
Major Support Level – $7,700
Major Resistance Level – $8,000


