
Reason to trust
How Our News is Made
Strict editorial policy that focuses on accuracy, relevance, and impartiality
Ad discliamer
Morbi pretium leo et nisl aliquam mollis. Quisque arcu lorem, ultricies quis pellentesque nec, ullamcorper eu odio.
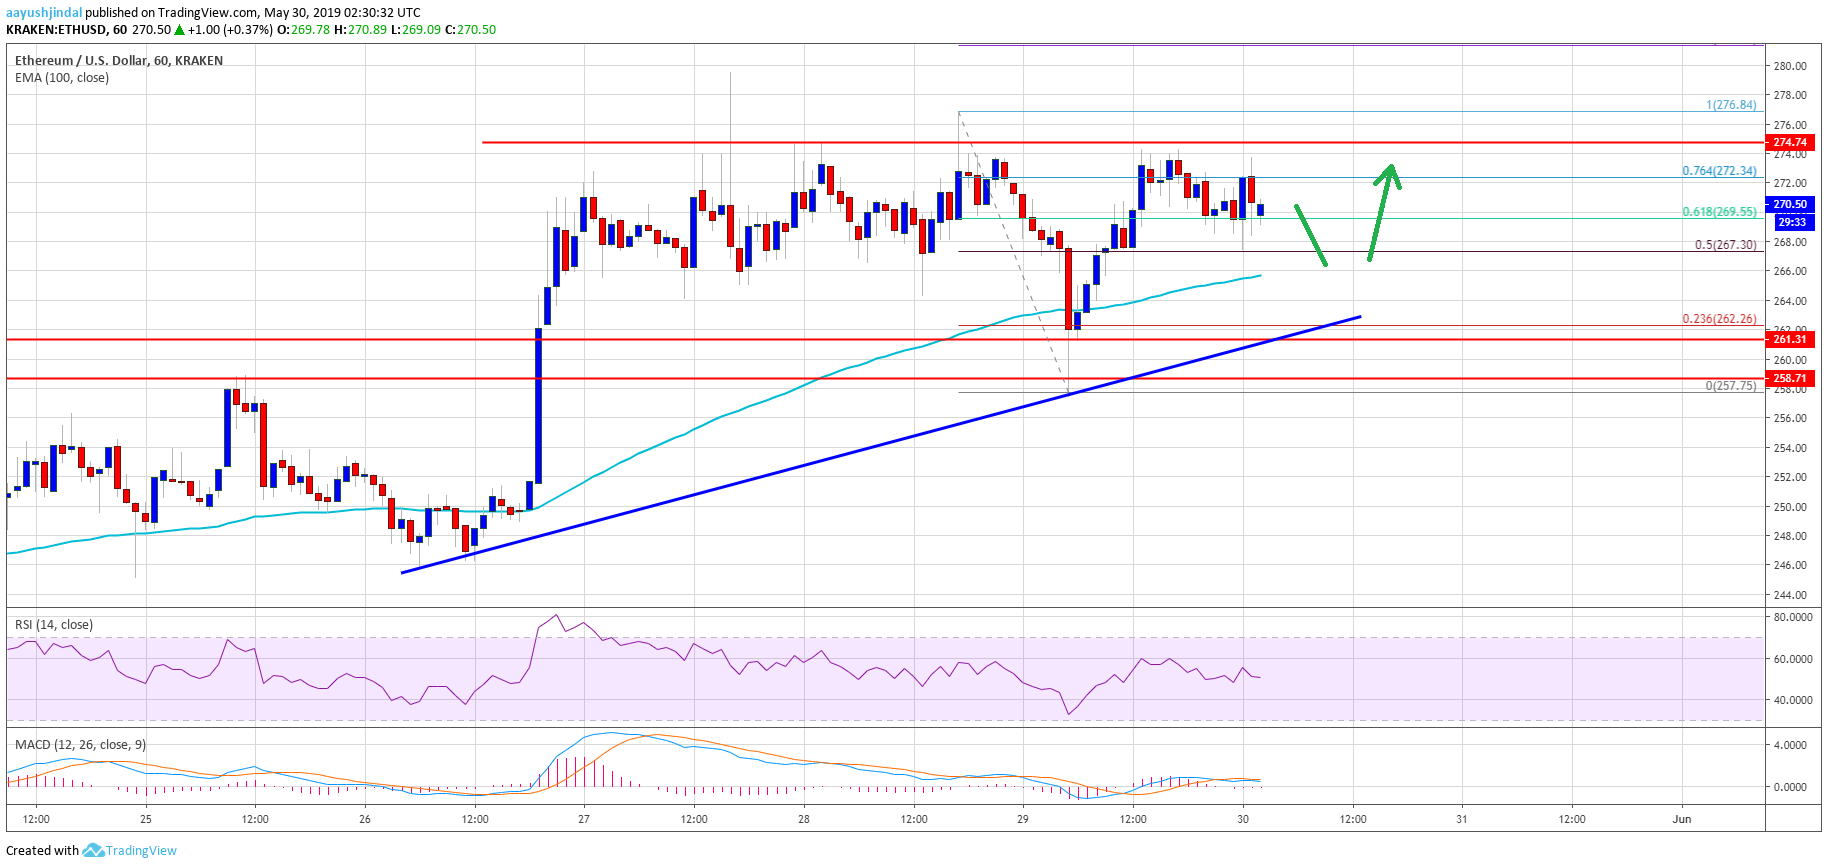
- ETH price started a solid upward move after testing the $258 support area against the US Dollar.
- The price reversed most its losses, but it is still struggling to clear the $280 resistance area.
- There is a new connecting bullish trend line forming with support near $262 on the hourly chart of ETH/USD (data feed via Kraken).
- The pair must break the $280 barrier to start a fresh increase towards the $300 and $305 levels.
Ethereum price is showing positive signs after the recent reversal versus the US Dollar, but consolidating vs bitcoin. ETH price is once again trading near the key $280 resistance area.
Ethereum Price Analysis
Recently, there was a major downside correction in Ethereum price below the $270 and $265 supports against the US Dollar. The ETH/USD pair even spiked below the $260 support and the 100 hourly simple moving average. However, the $258 level acted as a strong support and protected losses. As a result, there was a sharp upward move above $260 and $265. The price reversed most its gains and broke the 61.8% Fib retracement level of the last decline from the $276 high to $258 low.
The price is currently trading well above the $265 level and the 100 hourly simple moving average. It even climbed above the 76.4% Fib retracement level of the last decline from the $276 high to $258 low. However, the $276 and $280 resistance levels are still acting as a solid barriers for the bulls. If there is an upside break above the $274 and $276 levels, the price could start a strong upward move. The next key resistances are near $280 and $288.
On the downside, an initial support is near the $268 level. There is also a new connecting bullish trend line forming with support near $262 on the hourly chart of ETH/USD. Therefore, if there is a downside correction, the price is likely to find bids near $265 or $262. If there are further losses, the price might revisit the $258 support area in the near term.
Looking at the chart, Ethereum price is back above key supports and trading in a range above the $265 support. Having said that, the bulls need to take control and push the price above $274, $276 and $280. If they continue to struggle, there is a risk of more losses below the $262 and $258 support levels in the coming sessions.
ETH Technical Indicators
Hourly MACD – The MACD for ETH/USD is slowly moving into the bearish zone, with negative signs.
Hourly RSI – The RSI for ETH/USD is currently well above the 50 level, with positive signs.
Major Support Level – $262
Major Resistance Level – $276


