
Reason to trust
How Our News is Made
Strict editorial policy that focuses on accuracy, relevance, and impartiality
Ad discliamer
Morbi pretium leo et nisl aliquam mollis. Quisque arcu lorem, ultricies quis pellentesque nec, ullamcorper eu odio.
- Bitcoin price rallied recently above the $8,300 and $8,650 resistance levels against the US Dollar.
- The price traded to a new 2019 high at $8,952 and it is currently consolidating gains.
- There is a key bullish flag pattern forming with resistance near $8,860 on the hourly chart of the BTC/USD pair (data feed from Kraken).
- The pair could start a fresh increase once it clears the $8,860 and $8,900 resistance levels.
Bitcoin price started consolidating gains after trading towards $9,000 against the US Dollar. BTC could correct in the short term, but it is likely to climb higher further above $9,000.
Bitcoin Price Analysis
Yesterday, we saw a significant upward move in bitcoin price above the $8,300 and $8,500 resistances against the US Dollar. The BTC/USD pair even broke the $8,700 resistance and settled above the 100 hourly simple moving average. The bulls took control and the price traded close to the $9,000 level. A new 2019 high was formed near $8,952 and the price is currently consolidating gains. It corrected below the $8,900 and $8,800 levels.
There was a test of the 23.6% Fib retracement level of the recent rally from the $7,900 low to $8,952 high. More importantly, there is a key bullish flag pattern forming with resistance near $8,860 on the hourly chart of the BTC/USD pair. Therefore, if there is an upside break above $8,860 and $8,900, the price is likely to resume its upward move. An immediate resistances are $8,950 and $9,000. Above $9,000, the bulls could aim $10K in the coming days. An intermediate resistance is near the $9,280 level.
Conversely, if there is a downside break below the $8,620 level, the price might trade towards the $8,450 or $8,425 supports. The 50% Fib retracement level of the recent rally from the $7,900 low to $8,952 high is also near the $8,426 level. Therefore, dips from the current levels are likely to find support near $8,450.
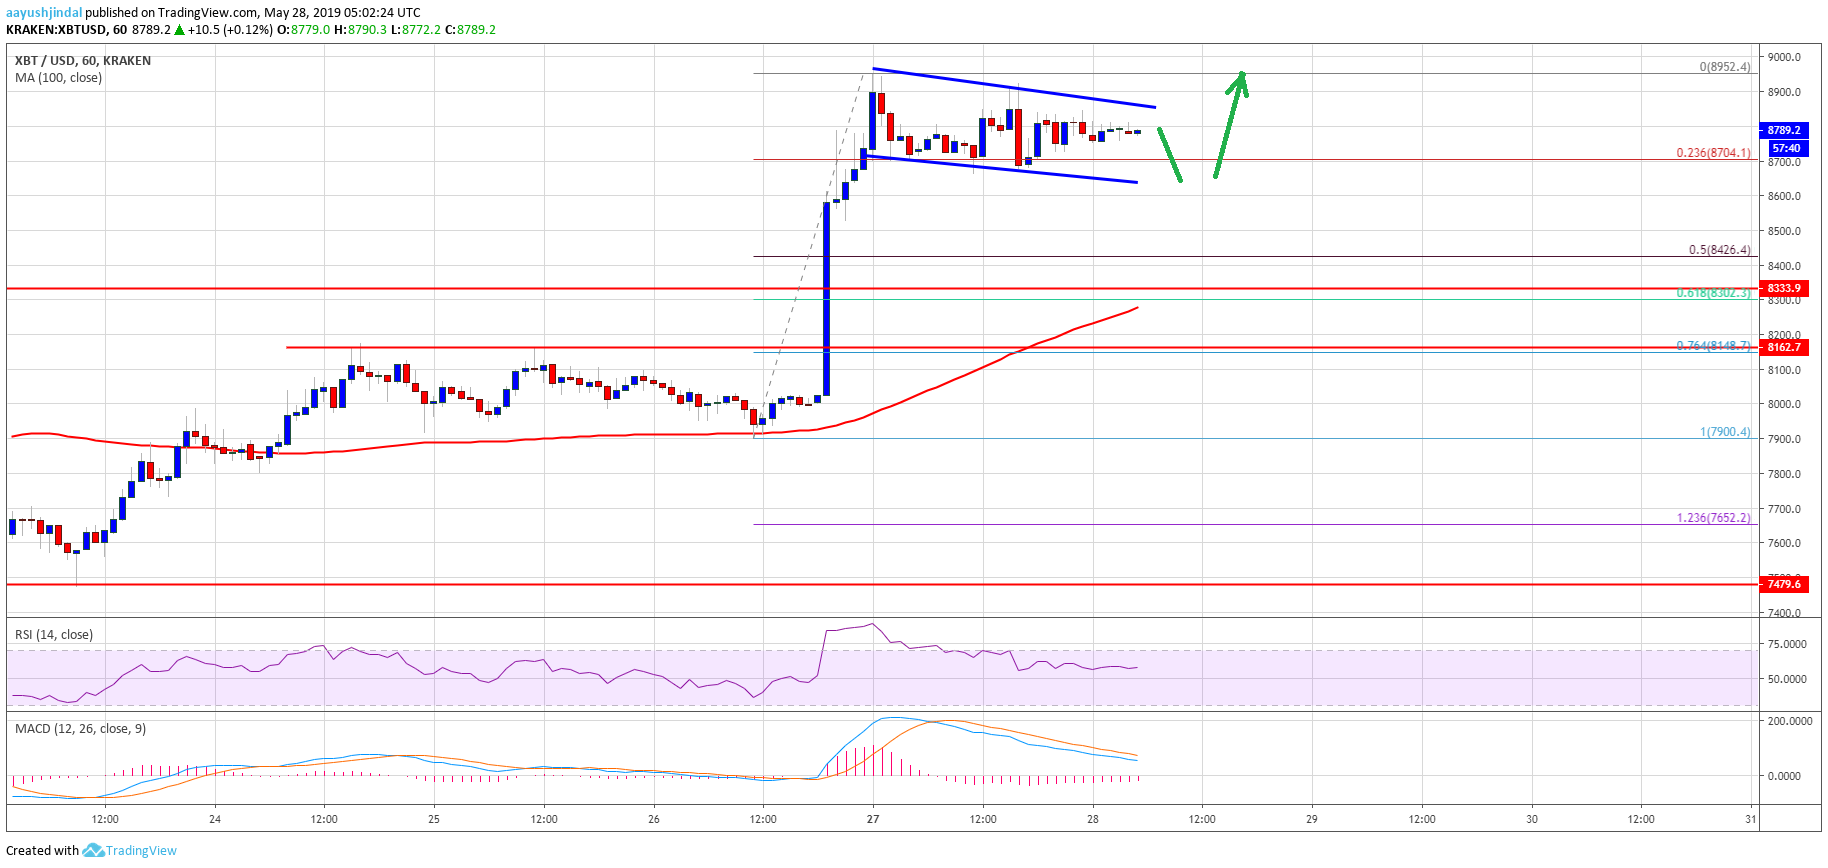
Looking at the chart, bitcoin price seems to consolidating recent gains above $7,600. As long as the price is above $7,600, it is likely to resume its rally above $8,860 and $8,950. The main targets could be $9,120 and $9,280. On the other hand, if the price starts a downside correction, the $8,450 support area could prevent losses. Below $8,425, the main support is near the $8,300 level and the 100 hourly simple moving average.
Technical indicators:
Hourly MACD – The MACD is likely to move back in the bullish zone once the current correction is complete.
Hourly RSI (Relative Strength Index) – The RSI for BTC/USD is slowly correcting lower towards the 55 and 50 levels.
Major Support Levels – $8,600 followed by $8,450.
Major Resistance Levels – $8,860, $8,950 and $9,000.


