
Reason to trust
How Our News is Made
Strict editorial policy that focuses on accuracy, relevance, and impartiality
Ad discliamer
Morbi pretium leo et nisl aliquam mollis. Quisque arcu lorem, ultricies quis pellentesque nec, ullamcorper eu odio.
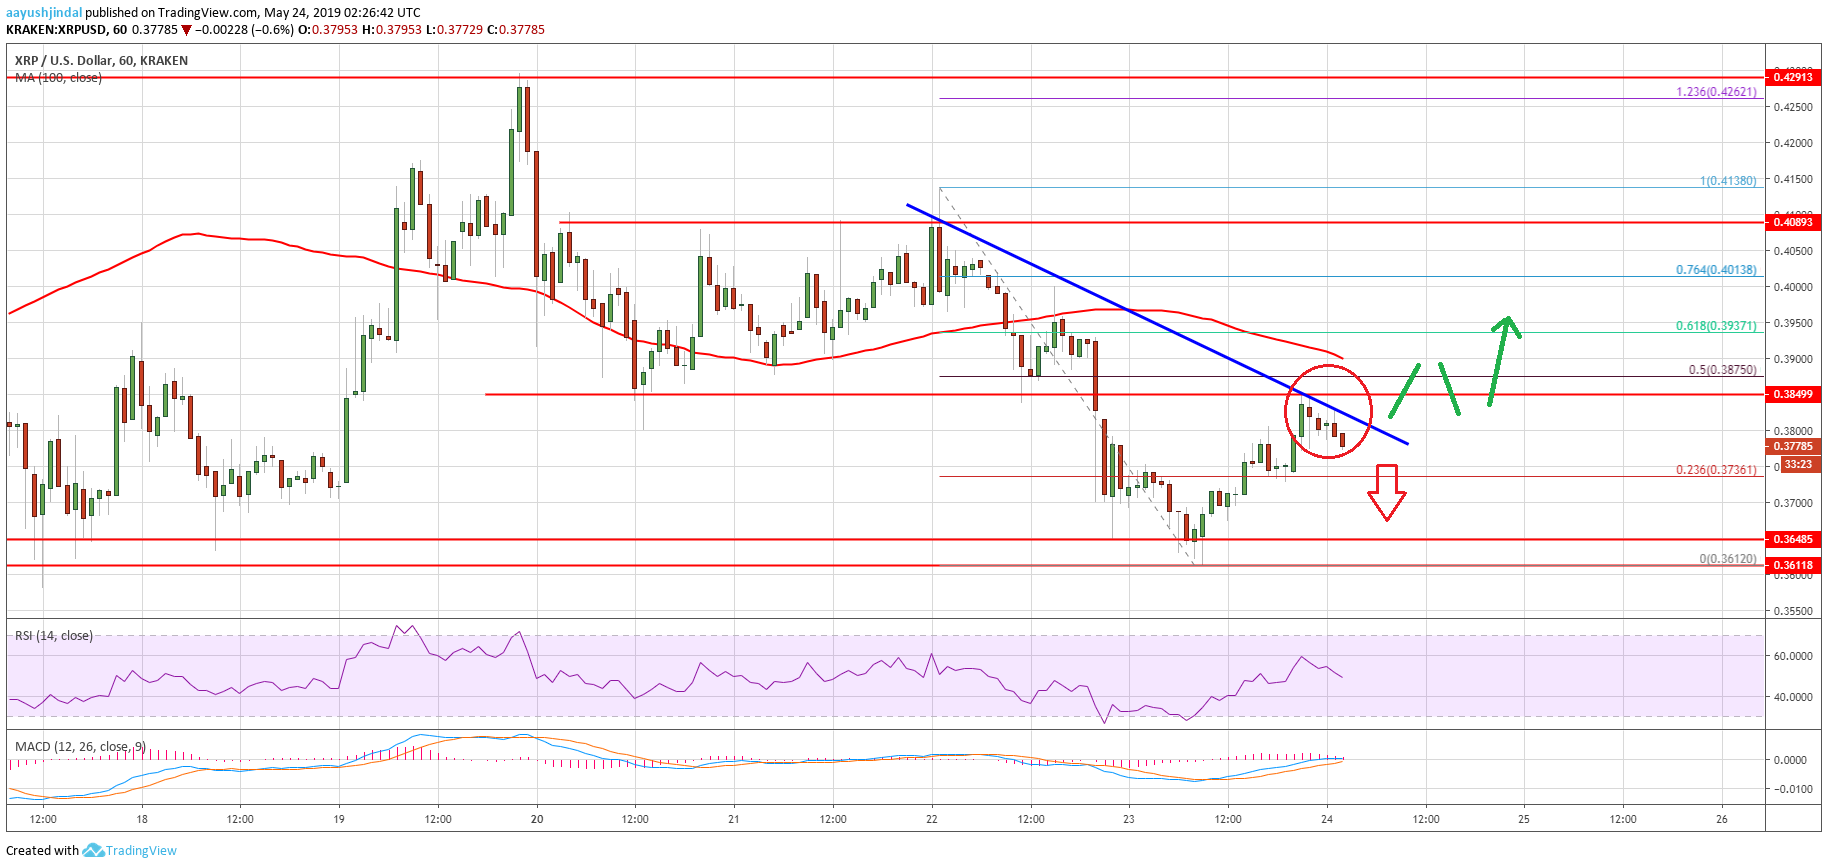
- Ripple price declined recently below the $0.3840 and $0.3750 support levels against the US dollar.
- The price tested the $0.3610 support area and it is currently correcting higher towards $0.3840.
- There is a key bearish trend line forming with resistance near the $0.3840 level on the hourly chart of the XRP/USD pair (data source from Kraken).
- The pair could resume its decline if it continues to struggle near $0.3840 and $0.3875.
Ripple price is currently under pressure against the US Dollar and bitcoin. XRP remains at a risk of more losses below the $0.3610 support unless it settles above $0.3880.
Ripple Price Analysis
After a couple of rejections near the $0.4080 barrier, ripple price started a major decline against the US Dollar. The XRP/USD pair declined below the $0.4000 and $0.3840 support levels. It even settled below $0.3840 and the 100 hourly simple moving average. Finally, there was a break below the $0.3750 support and the price tested the key $0.3610 support area. A new weekly low was formed near $0.3612 and the price is currently correcting higher.
It climbed above the $0.3750 resistance and the 23.6% Fib retracement level of the recent drop from the $0.4138 high to $0.3612 low. However, the price is facing a strong resistance near the $0.3840 and $0.3850 levels. Besides, there is a key bearish trend line forming with resistance near the $0.3840 level on the hourly chart of the XRP/USD pair. Above the trend line, the 50% Fib retracement level of the recent drop from the $0.4138 high to $0.3612 low is near $0.3875. Finally, the 100 hourly simple moving average is close to the $0.3900 level to act as a strong resistance.
Therefore, a successful close above the trend line and $0.3880 is must for more gains in the near term. If the bulls gain momentum above $0.3880, the price is likely to test the $0.4000 resistance. The next major resistance is near the $0.4080 level. On the other hand, if the price fails to climb above $0.3880, it could resume its decline.
Looking at the chart, ripple price seems to be facing a strong resistance near the $0.3840 and $0.3850. Unless it gains pace above $0.3850, there is a risk of a downside break. An immediate support is at $0.3750, followed by the main $0.3610 support. Any further losses are likely to lead the price towards the $0.3500 support.
Technical Indicators
Hourly MACD – The MACD for XRP/USD is about to move back in the bearish zone.
Hourly RSI (Relative Strength Index) – The RSI for XRP/USD is currently declining and recently moved below 50.
Major Support Levels – $0.3750, $0.3610 and $0.3500.
Major Resistance Levels – $0.3850, $0.3880 and $0.4000.


