
Reason to trust
How Our News is Made
Strict editorial policy that focuses on accuracy, relevance, and impartiality
Ad discliamer
Morbi pretium leo et nisl aliquam mollis. Quisque arcu lorem, ultricies quis pellentesque nec, ullamcorper eu odio.
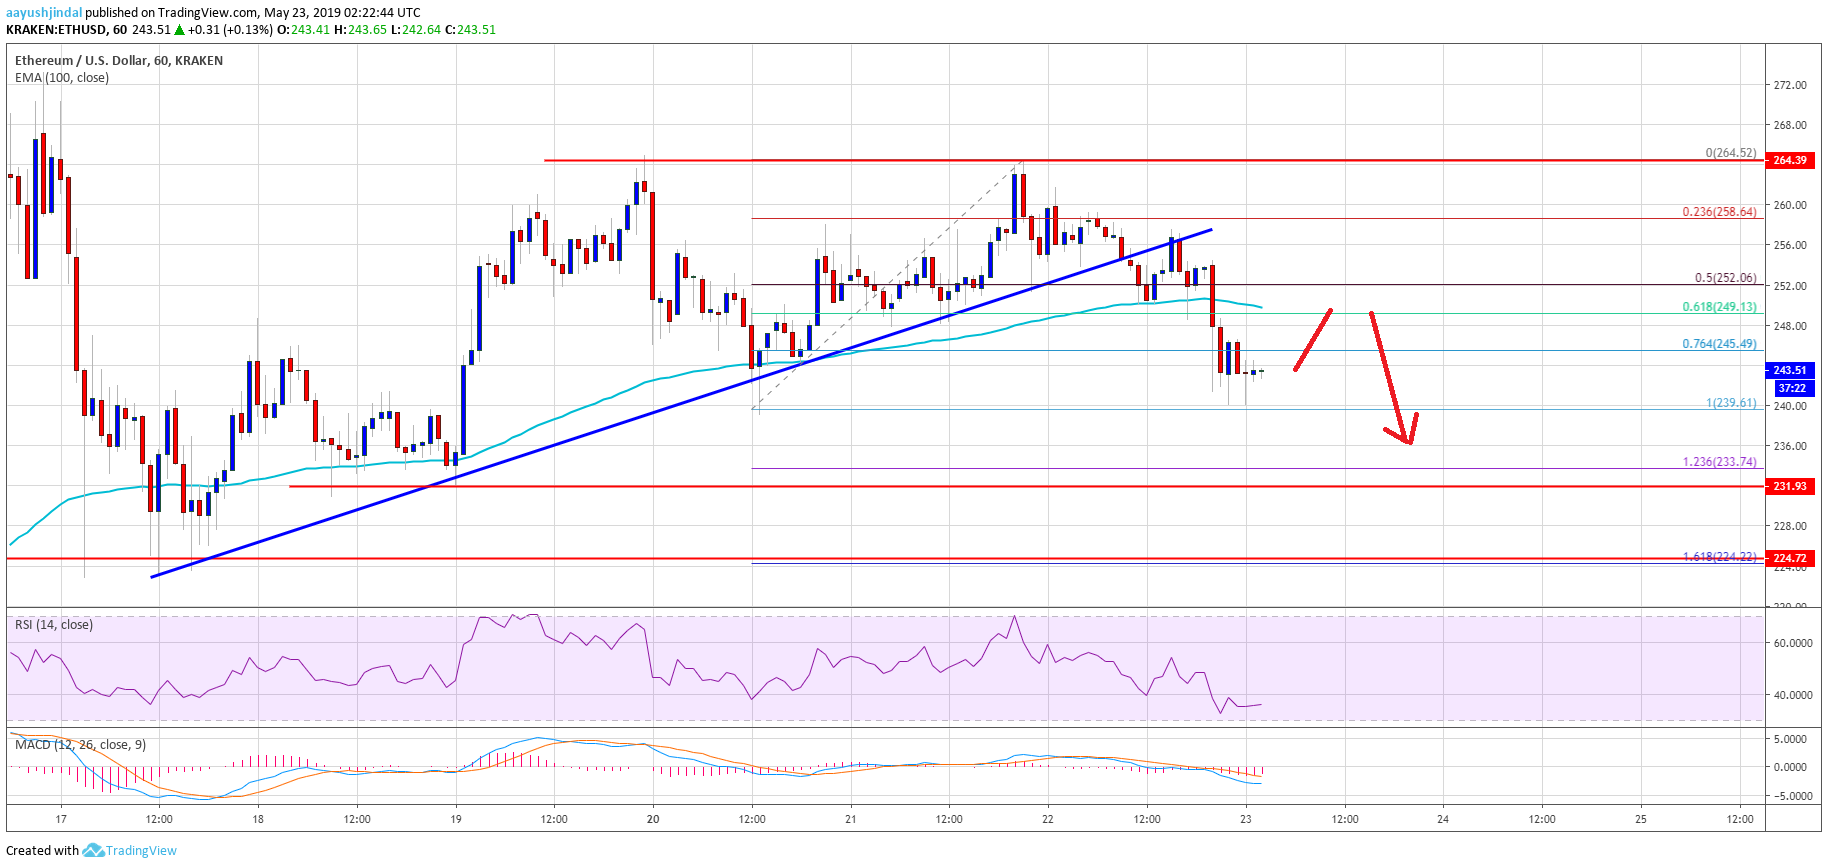
- ETH price failed to move above the $265 resistance area and recently declined against the US Dollar.
- The price traded below the $258 and $252 support levels to start a short term bearish wave.
- This week’s important bullish trend line was breached with support at $256 on the hourly chart of ETH/USD (data feed via Kraken).
- The pair is likely to test the $232 support area, where the bulls are likely to emerge.
Ethereum price started a short term downward move versus the US Dollar and bitcoin. ETH might test $232 or $230 before it could start a fresh increase towards $265 or $270.
Ethereum Price Analysis
In the past three days, Ethereum price mostly traded in a range with positive moves above $250 against the US Dollar. However, the ETH/USD pair struggled to gain momentum above the $265 resistance level. There were two failures recently, resulting in a bearish reaction below $260. The price declined recently and broke the $258 and $252 support levels. Besides, there was a break below the 61.8% Fib retracement level of the upward move from the $239 swing low to $265 resistance.
Moreover, this week’s important bullish trend line was breached with support at $256 on the hourly chart of ETH/USD. The pair is now trading near the last swing low at $239 and it is currently consolidating losses. An initial resistance on the upside is near the $249 level and the 100 hourly simple moving average. However, a proper close above $252 is needed to start an increase towards the $265 resistance. On the downside, the next key support is near the $234 level. It coincides with the 1.236 Fib extension level of the upward move from the $239 swing low to $265 resistance.
If there are more losses below the $233 and $232 supports, the price could test the $224 support area. The stated $224 level acted as a strong support earlier this month. Besides, it is close to the 1.618 Fib extension level of the upward move from the $239 swing low to $265 resistance.
Looking at the chart, Ethereum price is currently trading in a bearish zone below the $252 level and the 100 hourly SMA. Therefore, there is a risk of a downside extension towards the $232 support before the price could stage a fresh increase. In the next few days, a successful close above the $265 resistance might push the price towards the $300 barrier.
ETH Technical Indicators
Hourly MACD – The MACD for ETH/USD is gaining momentum in the bearish zone.
Hourly RSI – The RSI for ETH/USD is currently well below the 40 level, with a neutral bias.
Major Support Level – $232
Major Resistance Level – $252


