
Reason to trust
How Our News is Made
Strict editorial policy that focuses on accuracy, relevance, and impartiality
Ad discliamer
Morbi pretium leo et nisl aliquam mollis. Quisque arcu lorem, ultricies quis pellentesque nec, ullamcorper eu odio.
- Bitcoin price started a downside correction after trading close to $8,350 against the US Dollar.
- The price declined below the $8,000 support and tested the $7,600-7,630 support area.
- There is a short term bearish trend line forming with resistance near $8,100 on the hourly chart of the BTC/USD pair (data feed from Kraken).
- The pair could retest the $7,600 support area before it could start a fresh increase above $8,200.
Bitcoin price corrected lower recently below $8,000 against the US Dollar. However, BTC remains well bid above $7,600 and it is likely to climb back above $8,200 and $8,300.
Bitcoin Price Analysis
Yesterday, we saw an extended rally in bitcoin price above the $8,000 barrier against the US Dollar. The BTC/USD pair broke the $8,200 and $8,300 resistance levels. It traded close to the $8,340 level and a new 2019 high was formed at $8,338. Later, the price started a downside correction below the $8,200 support, but remained well above the 100 hourly simple moving average. The price declined below the $8,000 support level and traded close to the key $7,600 support area. A swing low was formed at $7,631 and the price recovered recently above $8,000.
There was a break above the 50% Fib retracement level of the recent decline from the $8,338 high to $7,631 low. However, the price seems to be facing a strong resistance near $8,150. The 61.8% Fib retracement level of the recent decline from the $8,338 high to $7,631 low is also preventing an upside break. Moreover, there is a short term bearish trend line forming with resistance near $8,100 on the hourly chart of the BTC/USD pair. Therefore, the pair needs to clear the trend line and $8,150 to start a fresh increase.
On the upside, an immediate resistance above $8,150 is at $8,220. The next key resistance is near the $8,340 level, above which the price could test the $8,500 level. The 1.236 Fib extension level of the recent decline from the $8,338 high to $7,631 low is also near the $8,505 level.
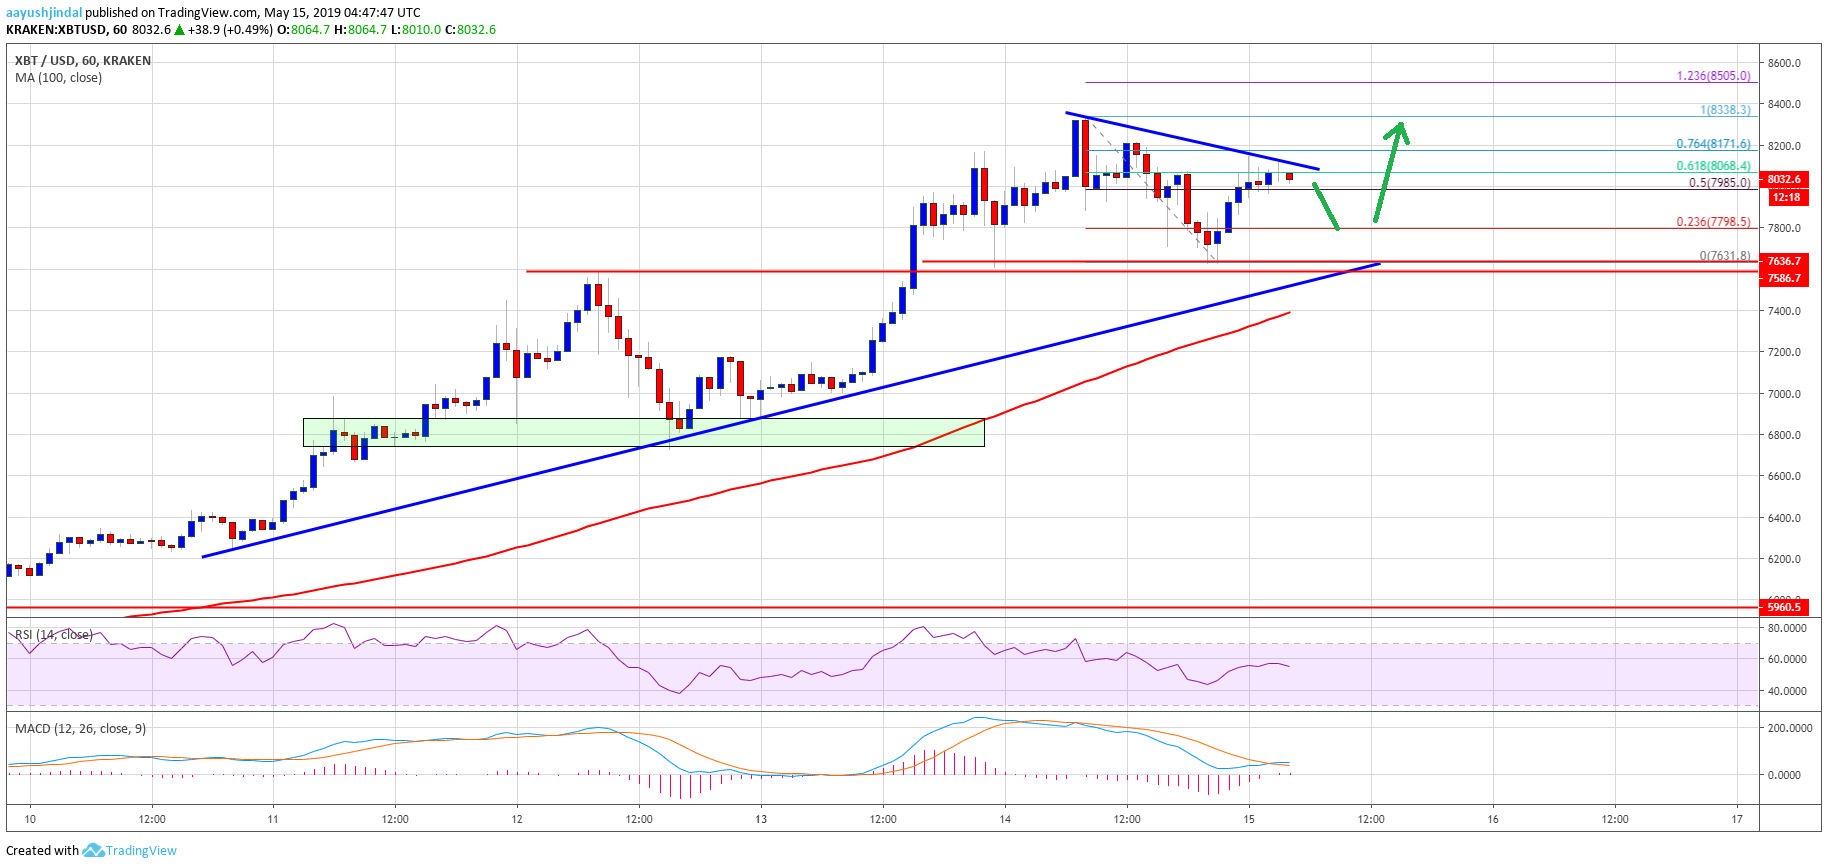
Looking at the chart, bitcoin price is currently consolidating above the $8,000 level. In the short term, there could be another drop towards $7,850 or even $7,630. However, there are many support on the downside near the $7,580 and $7,600 levels. Besides, this week’s followed important bullish trend line is intact with support at $7,580. As long as the price is above the trend line support, it is likely to break $8,150 and $8,340.
Technical indicators:
Hourly MACD – The MACD is likely to move back in the bullish zone.
Hourly RSI (Relative Strength Index) – The RSI for BTC/USD is currently flat above the 50 level.
Major Support Levels – $7,850 followed by $7,630.
Major Resistance Levels – $8,100, $8,150 and $8,340.


