
Reason to trust
How Our News is Made
Strict editorial policy that focuses on accuracy, relevance, and impartiality
Ad discliamer
Morbi pretium leo et nisl aliquam mollis. Quisque arcu lorem, ultricies quis pellentesque nec, ullamcorper eu odio.
- ETH price started a fresh decline after tagging the key $180 resistance level against the US Dollar.
- The price broke the $175 and $169 support levels to test the next support near $164.
- There is a short term connecting bearish trend line in place with resistance at $172 on the hourly chart of ETH/USD (data feed via Kraken).
- The pair could consolidate for a few hours before it could test the $172 and $174 resistance levels.
Ethereum price trimmed most its recent gains versus the US Dollar and bitcoin. ETH tested the $164 support and it may soon bounce back above $170 in the coming sessions.
Ethereum Price Analysis
Yesterday, Ethereum price climbed above the key $170 and $175 resistance levels against the US Dollar. The ETH/USD pair even broke the $178 level and settled above the 100 hourly simple moving average. It tested the $180 resistance zone, where sellers appeared. Later, there was a downward move below the $175 support level. The decline gathered pace after the report of 7,000 BTC hack from the cryptocurrency exchange, binance. It fueled the downside and pushed the price below $169 and the 100 hourly SMA.
The price even broke the 61.8% Fib retracement level of the upward move from the $160 low to $180 high. Finally, the price found support near the $164 level and it is currently consolidating losses. An immediate resistance is near the $168 level and the 100 hourly SMA. Besides, the 23.6% Fib retracement level of the recent drop from the $180 high to $164 low is also near the $168 level. Above $168, there are many hurdles near the $170 and $172 levels.
There is also a short term connecting bearish trend line in place with resistance at $172 on the hourly chart of ETH/USD. The trend line coincides with the 50% Fib retracement level of the recent drop from the $180 high to $164 low. Therefore, a clear break above the $172 level is needed for the price to start a fresh increase. The next key resistances are near the $175 and $180 levels.
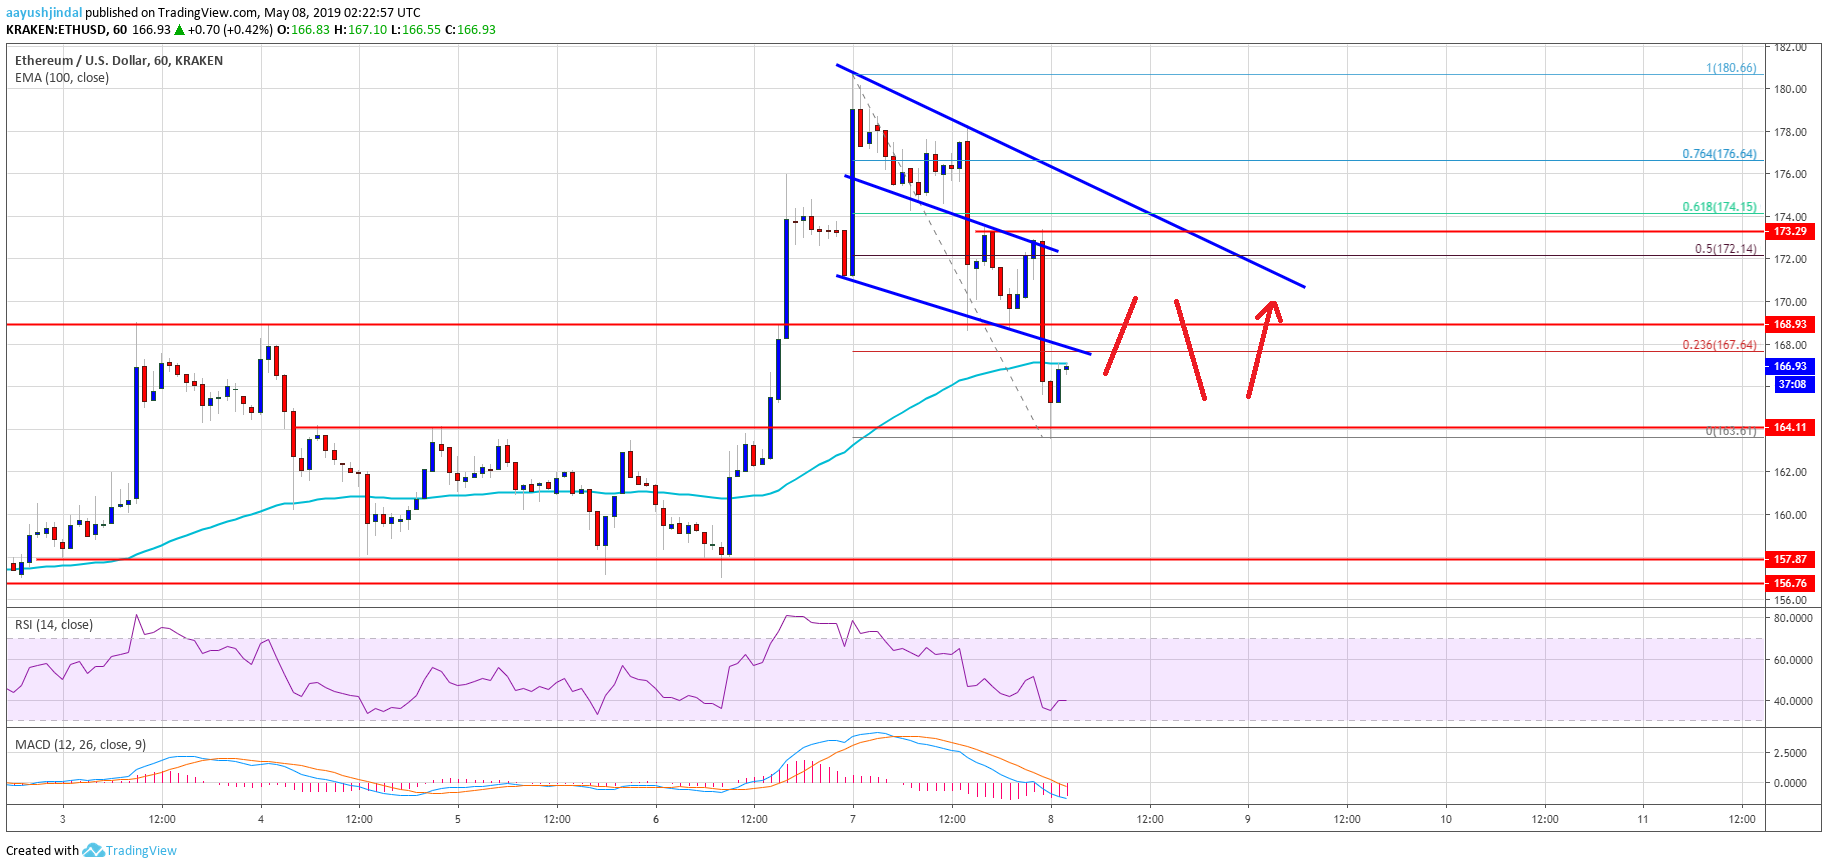
Looking at the chart, Ethereum price clearly trimmed most its gains and declined below the key $170 support. If the price fails to hold the $164 support, there could be more losses. The next key support is near the $160 level, below which the price may retest the $156 support area.
ETH Technical Indicators
Hourly MACD – The MACD for ETH/USD moved back in the bearish zone, with a negative bias.
Hourly RSI – The RSI for ETH/USD declined steadily below the 50 level and it is currently near the 40 level.
Major Support Level – $164
Major Resistance Level – $172


