
Reason to trust
How Our News is Made
Strict editorial policy that focuses on accuracy, relevance, and impartiality
Ad discliamer
Morbi pretium leo et nisl aliquam mollis. Quisque arcu lorem, ultricies quis pellentesque nec, ullamcorper eu odio.
- Ripple price declined further below the $0.3040 and $0.3000 support levels against the US dollar.
- The price remained in a bearish zone below $0.3200 as discussed in yesterday’s analysis.
- There is a major bearish trend line in place with resistance at $0.3060 on the hourly chart of the XRP/USD pair (data source from Kraken).
- The pair could correct higher in the short term, but it is likely to decline further towards $0.2850.
Ripple price extended losses and broke key supports against the US Dollar and bitcoin. XRP is currently in a bearish zone and it could continue to move down towards $0.2850 or $0.2820.
Ripple Price Analysis
Yesterday, we saw the start of a strong decline from the $0.3300 resistance area in ripple price against the US Dollar. The XRP/USD pair declined sharply below the $0.3250 and $0.3220 support levels. There was even a close below the $0.3200 level and the 100 hourly simple moving average. A swing low was formed near $0.3175 and later the price corrected higher. It moved above $0.3200, but it failed below the 50% Fib retracement level of the drop from the $0.3288 high to $0.3175 low.
As a result, there was a fresh decline below the $0.3175 support area (as discussed in yesterday’s analysis). There was a sharp decline below the $0.3100 and $0.3040 support levels. The price even broke the $0.3000 support to register more than 10% intraday drop. It traded close to the $0.2900 level and a swing low was formed at $0.2904. At the moment, the price is consolidating losses above the $0.2910 level. It recovered above the 23.6% Fib retracement level of the recent drop from the $0.3216 high to $0.2904 low. On the upside, there are many hurdles near the $0.3050 and $0.3060 levels.
There is also a major bearish trend line in place with resistance at $0.3060 on the hourly chart of the XRP/USD pair. The trend line coincides with the 50% Fib retracement level of the recent drop from the $0.3216 high to $0.2904 low. Therefore, it won’t be easy for the bulls to push the price above the $0.3050 and $0.3060 resistance levels.
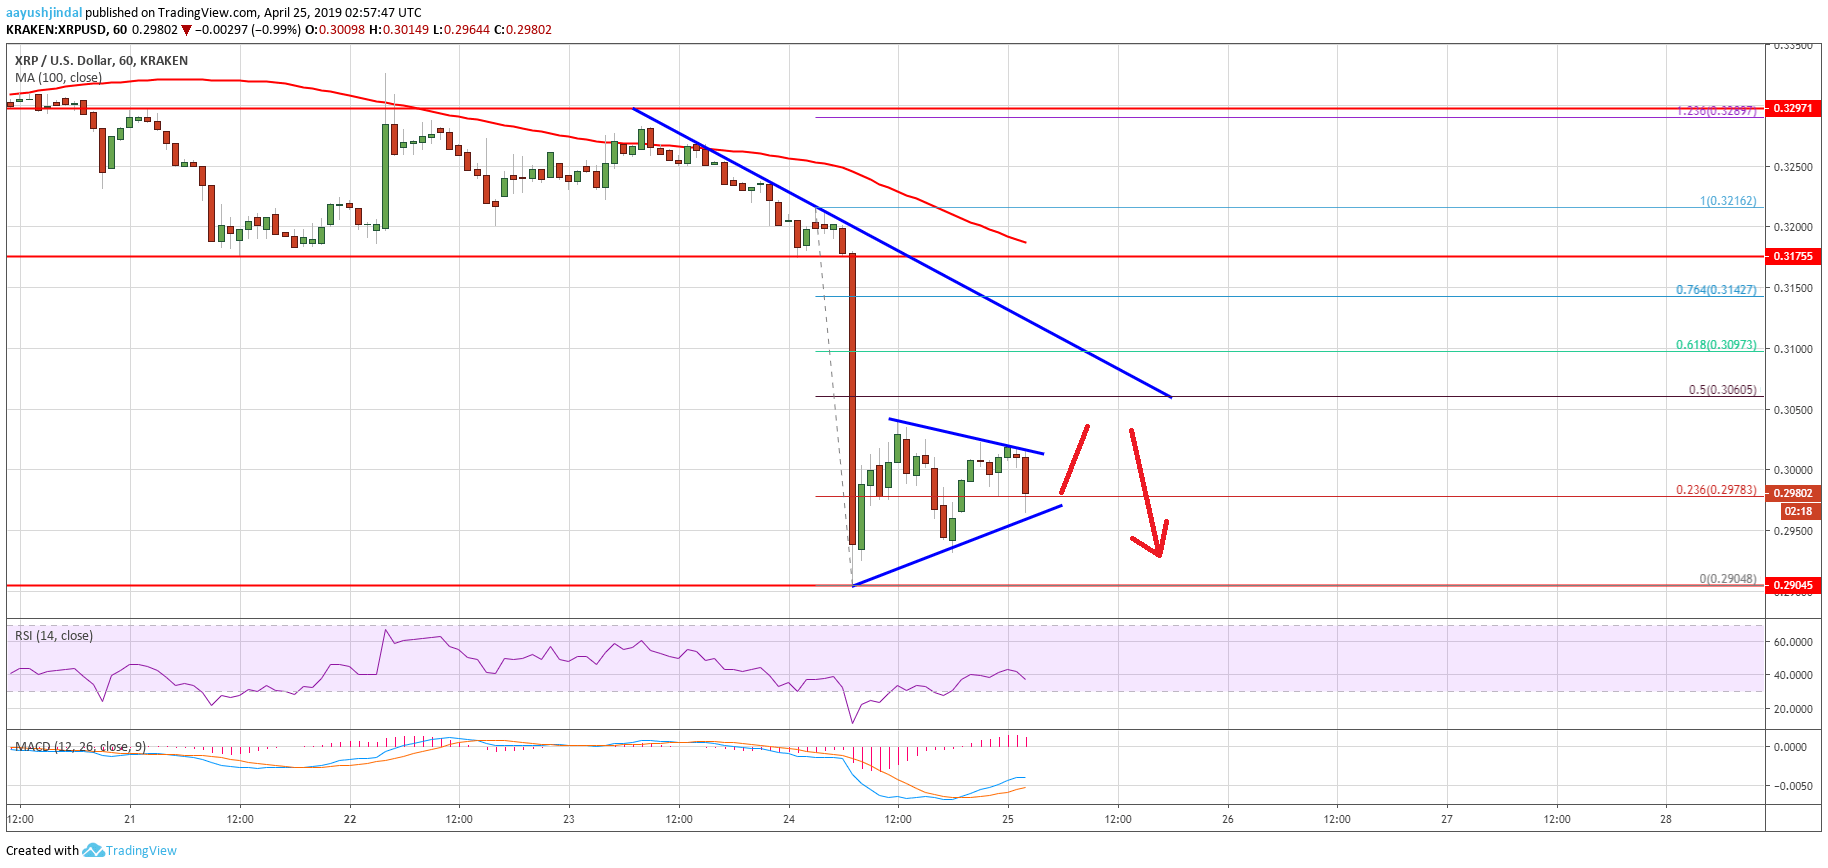
Looking at the chart, ripple price is clearly under a lot of bearish pressure below $0.3100 and the 100 hourly SMA. There is a risk of more losses below the $0.2900 support levels. Sellers may push the price towards $0.2850 or even $0.2820.
Technical Indicators
Hourly MACD – The MACD for XRP/USD could move back in a bearish zone in the short term.
Hourly RSI (Relative Strength Index) – The RSI for XRP/USD is currently well below the 50 and 40 levels.
Major Support Levels – $0.2900, $0.2850 and $0.2820.
Major Resistance Levels – $0.3050, $0.3060 and $0.3070.


