
Reason to trust
How Our News is Made
Strict editorial policy that focuses on accuracy, relevance, and impartiality
Ad discliamer
Morbi pretium leo et nisl aliquam mollis. Quisque arcu lorem, ultricies quis pellentesque nec, ullamcorper eu odio.
- Bitcoin price corrected lower recently and traded below $5,500 and $5,480 against the US Dollar.
- The price traded close to the $5,370 level and it is currently trading with a bearish bias.
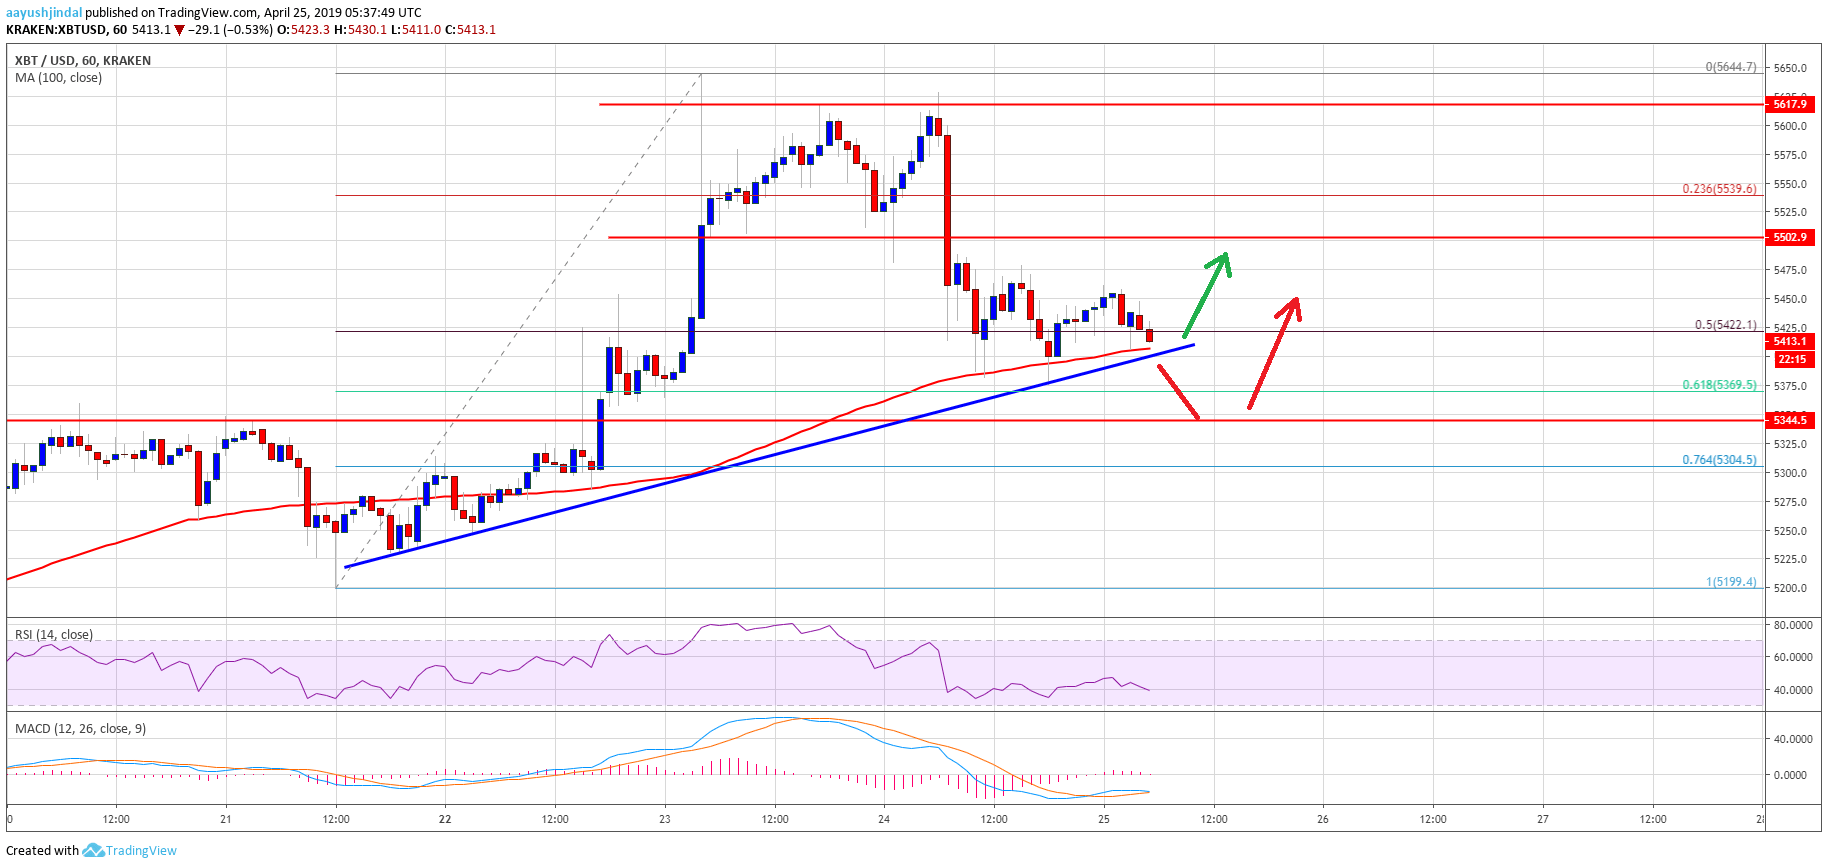
- There is a key bullish trend line formed with support at $5,405 on the hourly chart of the BTC/USD pair (data feed from Kraken).
- The pair could extend losses towards the $5,340 support before it could bounce back.
Bitcoin price started a major downside correction below $5,450 against the US Dollar. BTC may test the key $5,340-5,350 support zone before it could start a fresh increase.
Bitcoin Price Analysis
After a strong upward move, bitcoin price started a downside correction from the $5,640 swing high against the US Dollar. The BTC/USD pair traded below the $5,600 and $5,520 levels to move into a short term bearish zone. The pair even broke the $5,480 support and settled below the key $5,450 support level. Recently, there was a break below the 50% Fib retracement level of the last wave from the $5,199 low to $5,644 high.
The price spiked below the $5,400 support and traded close to the $5,370 level. Besides, the price traded close to the 61.8% Fib retracement level of the last wave from the $5,199 low to $5,644 high. At the moment, the price is consolidating above the $5,400 level and the 100 hourly simple moving average. There is also a key bullish trend line formed with support at $5,405 on the hourly chart of the BTC/USD pair. Clearly, the price is trading near a strong support at $5,400. If there is a downside break below $5,400 and the 100 hourly SMA, the price could extend losses.
The next key support area is near $5,350-5,340 (the previous major resistance). The bulls are likely to defend the $5,340 support area in the near term. On the upside, the price must break the $5,450 resistance to start a decent rebound. However, the main resistance is at $5,500, above which the price could move back towards the $5,640 level.
Looking at the chart, bitcoin price seems to be extending its decline towards the $5,350 level. However, it won’t be easy for sellers to clear the $5,340-5,350 support area. Once the current correction is complete, the price is likely to bounce back in the near term. Further below $5,340, the price might move into a bearish zone towards the $5,000 handle.
Technical indicators:
Hourly MACD – The MACD is struggling to gain pace in the bullish zone.
Hourly RSI (Relative Strength Index) – The RSI for BTC/USD is now well below the 50 level and it could slide towards 35 or 30.
Major Support Levels – $5,400 followed by $5,340.
Major Resistance Levels – $5,450, $5,500 and $5,540.


