
Reason to trust
How Our News is Made
Strict editorial policy that focuses on accuracy, relevance, and impartiality
Ad discliamer
Morbi pretium leo et nisl aliquam mollis. Quisque arcu lorem, ultricies quis pellentesque nec, ullamcorper eu odio.
- Bitcoin price broke the main resistance at $5,400 and rallied sharply against the US Dollar.
- The price traded to a new 2019 high and it remains in an uptrend above $5,350.
- There is a major bullish trend line forming with support at $5,360 on the hourly chart of the BTC/USD pair (data feed from Kraken).
- The pair has likely started a strong upward move towards the $5,800 and $6,000 resistance levels.
Bitcoin price rallied sharply above $5,400 and $5,600 against the US Dollar. BTC is likely to extend gains and it may continue to grind higher towards the $5,800 and $6,000 resistance.
Bitcoin Price Analysis
After a short term downside correction, bitcoin price found support near the $5,200 level against the US Dollar. The BTC/USD pair formed a strong support base above $5,200 and later started a steady rise. There was a break above the $5,300 resistance and the 100 hourly simple moving average. The price traded in a range for a few hours and recently broke the key $5,350 resistance to start a strong rally. The bulls came into action and pushed the price above the $5,400 and $5,500 resistance levels (as discussed in the previous analysis).
The price even broke the $5,600 level and traded to a new 2019 high at $5,641. Recently, it corrected gains below the $5,600 level and the 23.6% Fib retracement level of the recent rise from the $5,360 low to $5,641 high. However, the $5,500 level is currently acting as a decent support. The 50% Fib retracement level of the recent rise from the $5,360 low to $5,641 high is also near the $5,500 level.
If there is a downside extension, the next key support is near the $5,420 level. It also coincides with the 76.4% Fib retracement level of the recent rise from the $5,360 low to $5,641 high. Moreover, there is a major bullish trend line forming with support at $5,360 on the hourly chart of the BTC/USD pair. Therefore, dips from the current levels are likely to face a strong buying interest near $5,400 and $5,360.
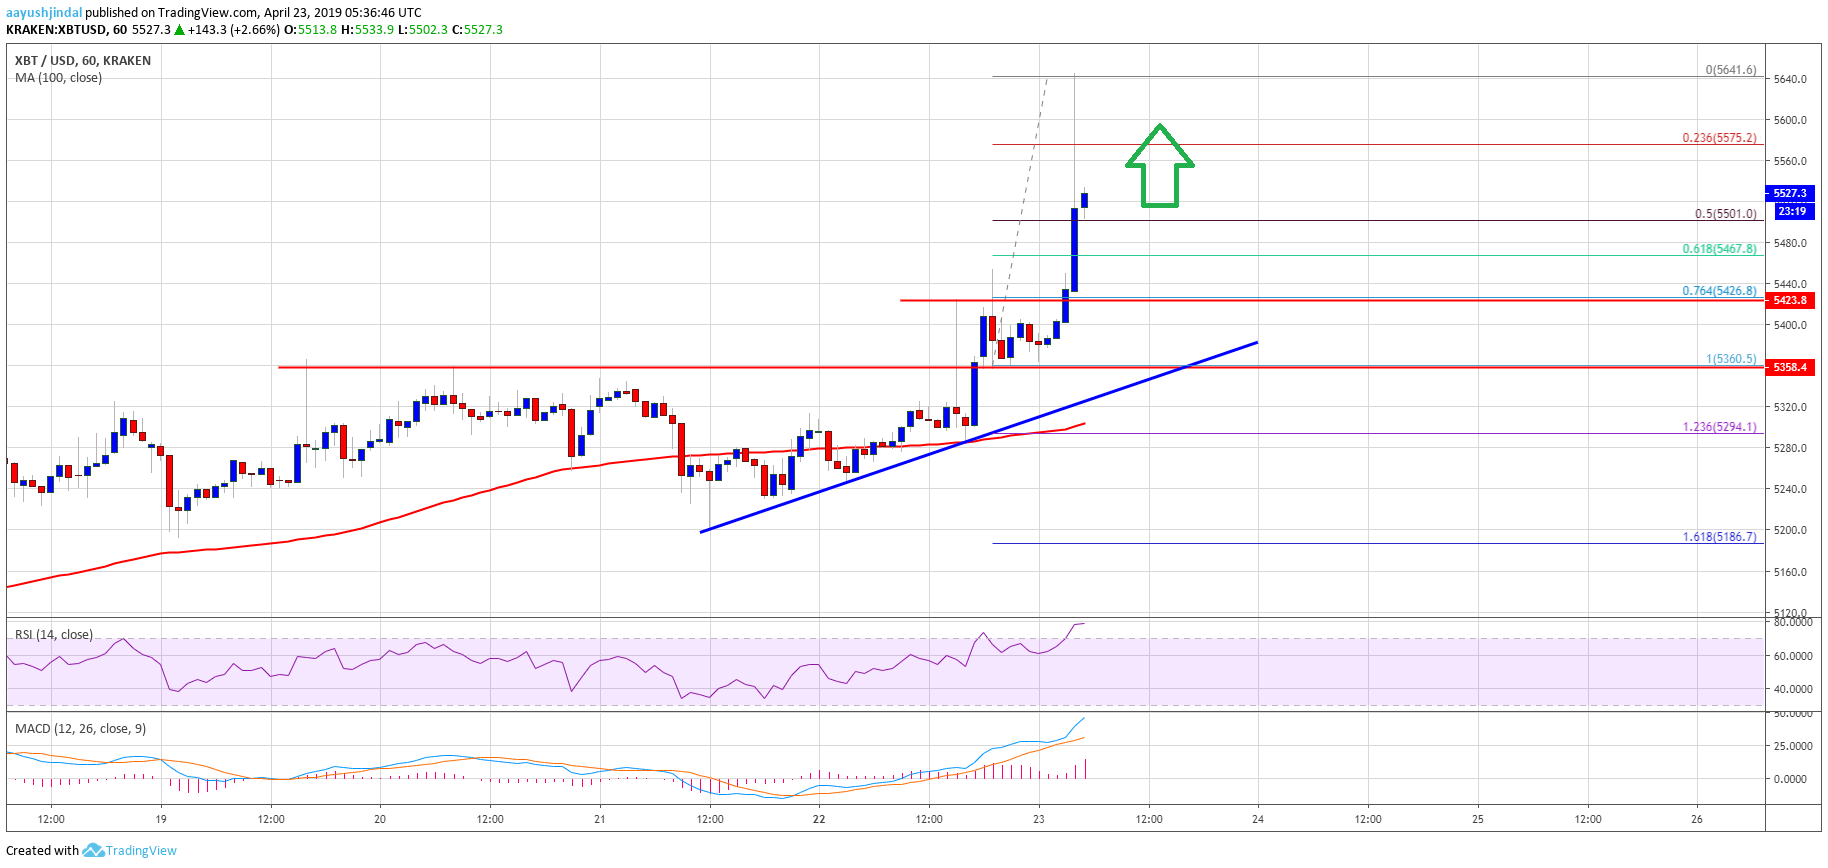
Looking at the chart, bitcoin price started a strong rally above the $5,400 resistance (as per our weekly analysis post). The bulls are clearly in control and they could aim further gains above $5,600 and $5,650. The next stop could be near the $5,800 level. If there are further gains, the price is likely to test the all-important $6,000 resistance area.
Technical indicators:
Hourly MACD – The MACD is gaining momentum in the bullish zone.
Hourly RSI (Relative Strength Index) – The RSI for BTC/USD climbed higher sharply above the 60 and 70 levels.
Major Support Levels – $5,500 followed by $5,420.
Major Resistance Levels – $5,600, $5,640 and $5,800.


