
Reason to trust
How Our News is Made
Strict editorial policy that focuses on accuracy, relevance, and impartiality
Ad discliamer
Morbi pretium leo et nisl aliquam mollis. Quisque arcu lorem, ultricies quis pellentesque nec, ullamcorper eu odio.
- ETH price formed a solid support near $155 and recovered nicely against the US Dollar.
- The price gained traction above the $162 resistance and the 100 hourly simple moving average.
- Yesterday’s highlighted key bearish trend line was breached at $164 on the hourly chart of ETH/USD (data feed via Kraken).
- The pair accelerated towards the $168 level and it may continue to rise towards the $175 level.
Ethereum price started a fresh upward move versus the US Dollar, with positive moves in bitcoin. ETH is likely preparing for more gains and it could reach the $175 resistance.
Ethereum Price Analysis
Recently, we saw an extended downside correction below the $160 level in Ethereum price against the US Dollar. The ETH/USD pair tested the $155 level and settled below the 100 hourly simple moving average. However, the $155 level acted as a strong support and later the price started a fresh increase. Bulls gained traction above the $160 resistance and the 50% Fib retracement level of the last drop from the $170 high to $155 low.
More importantly, yesterday’s highlighted key bearish trend line was breached at $164 on the hourly chart of ETH/USD. The pair rallied above the $162 level and the 100 hourly SMA. Besides, there was a break below the 61.8% Fib retracement level of the last drop from the $170 high to $155 low. The price traded close to the $170 resistance area and formed a high near $168. It is currently consolidating gains above the broken trend line and the 100 hourly SMA. An immediate support is $165 and the 23.6% Fib retracement level of the recent wave from the $155 low to $168 high.
On the upside, a break above the $168 and $170 resistance levels may open the doors for more gains. The next stop for buyers could be $175, where sellers could appear. Having said that, if there is an upside break above $175, the price could continue to accelerate towards the $180 resistance.
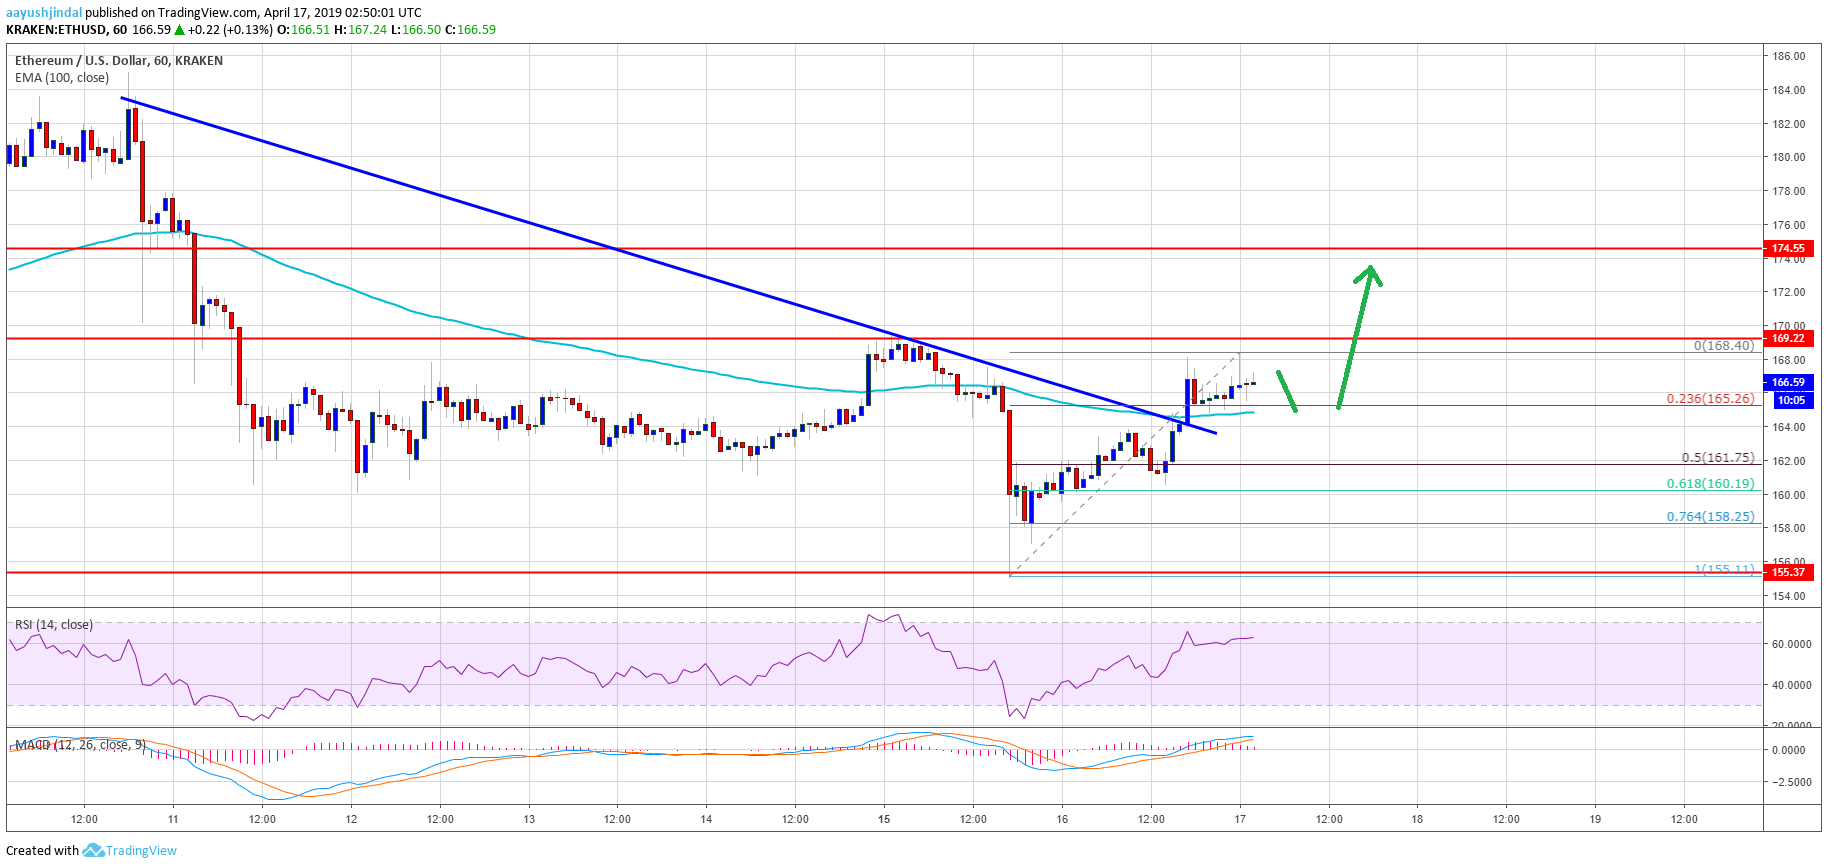
Looking at the chart, Ethereum price is showing positive signs above the $165 and $162 support levels. In the short term, there might be range moves above the $162 support. If there is an extended correction, the price could test the 50% Fib retracement level of the recent wave from the $155 low to $168 high. Finally, the price is likely to clear the $170 resistance to test $175.
ETH Technical Indicators
Hourly MACD – The MACD for ETH/USD moved back in the bullish zone, with positive signs.
Hourly RSI – The RSI for ETH/USD bounced back above 50 and it is currently near the 60 level.
Major Support Level – $162
Major Resistance Level – $170


