
Reason to trust
How Our News is Made
Strict editorial policy that focuses on accuracy, relevance, and impartiality
Ad discliamer
Morbi pretium leo et nisl aliquam mollis. Quisque arcu lorem, ultricies quis pellentesque nec, ullamcorper eu odio.
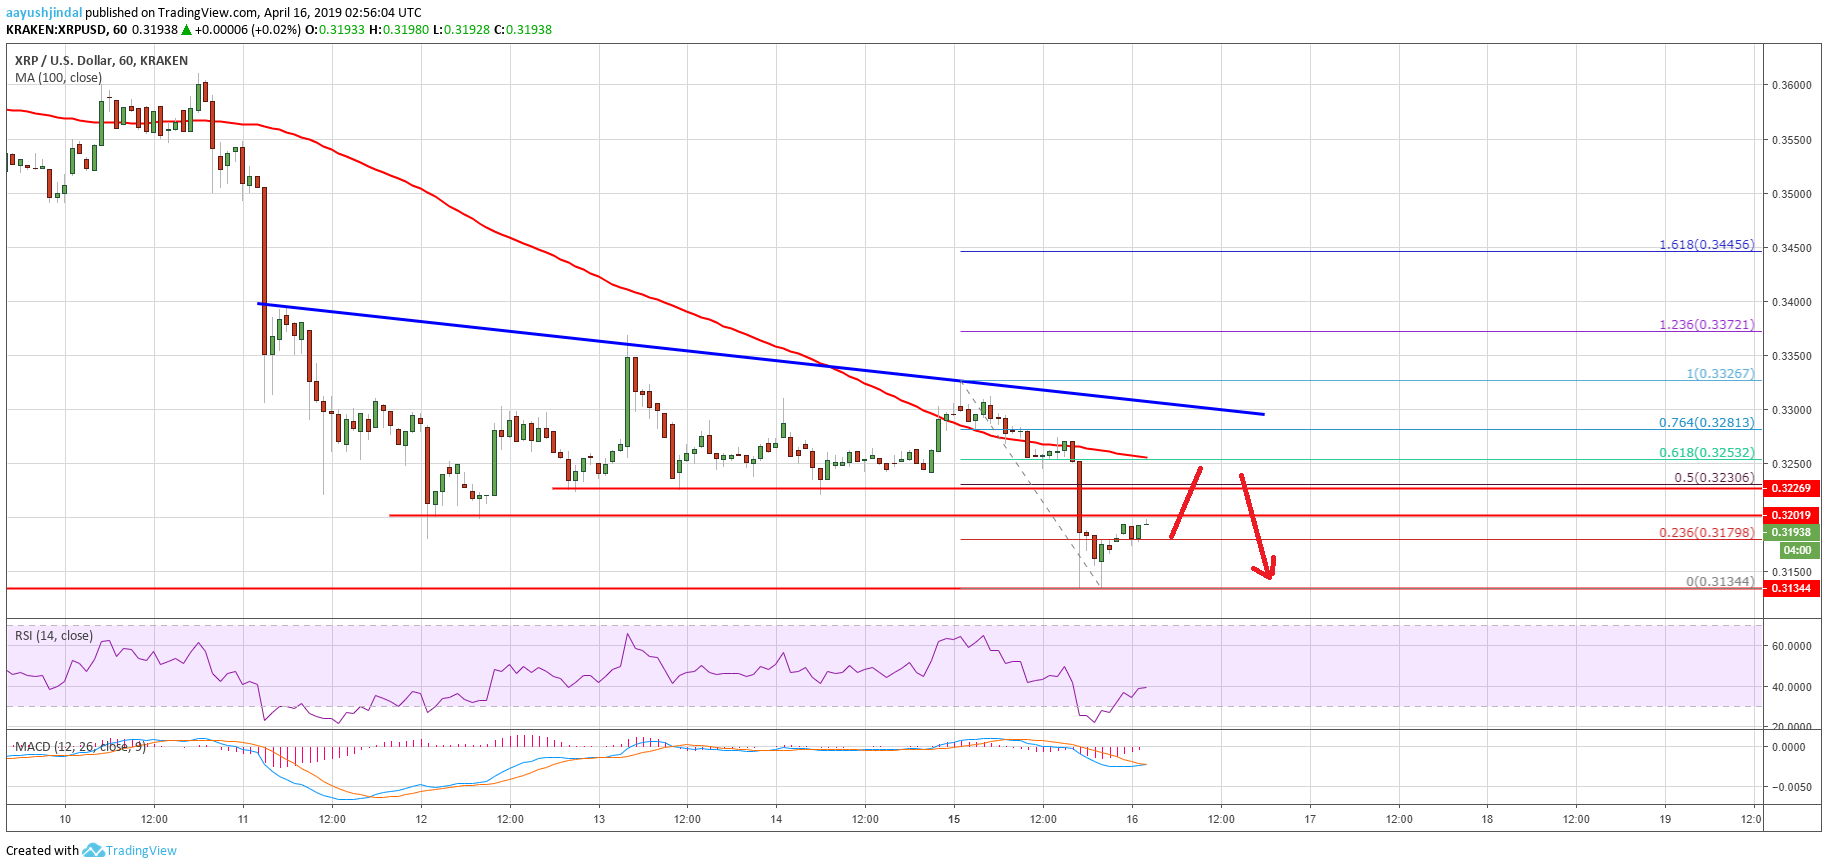
- Ripple price failed near the $0.3370 level and declined below the $0.3250 support against the US dollar.
- The price traded to a new weekly low at $0.3134 and remains at a risk of more losses in the short term.
- There is a major bearish trend line formed with resistance near $0.3285 on the hourly chart of the XRP/USD pair (data source from Kraken).
- The pair could extend the current decline and it may even revisit the key $0.3000 support area.
Ripple price failed to gain bullish momentum against the US Dollar and bitcoin. XRP declined below $0.3220 and it may continue to decline towards $0.3000 before completing a correction.
Ripple Price Analysis
Yesterday, we saw a strong buying interest above $0.3200 and ripple price recovered above $0.3280 against the US Dollar. The XRP/USD pair even broke the $0.3350 level, but it failed to clear the $0.3370 level. It seems like the price struggled to settle above the $0.3350 level and the 100 hourly simple moving average. As a result, there was a fresh decline below $0.3280 and $0.3250. The price even broke the $0.3220 and $0.3200 support levels. A new weekly low was formed at $0.3134 and the price settled well below the 100 hourly simple moving average.
At the moment, the price is correcting higher above $0.3150. It broke the 23.6% Fib retracement level of the recent decline from the $0.3326 high to $0.3134 low. However, there are many resistances on the upside, starting with $0.3220 and $0.3230. The 50% Fib retracement level of the recent decline from the $0.3326 high to $0.3134 low is also near $0.3230. Above $0.3230, the 100 hourly SMA could prevent gains above $0.3250. There is also a major bearish trend line formed with resistance near $0.3285 on the hourly chart of the XRP/USD pair.
Therefore, the price is likely to struggle between $0.3250 and $0.3280 in the short term. If bulls fail to surpass the trend line and $0.3300, there are chances of a fresh decline. An initial support is near the recent low at $0.3130, below which the price may revisit the $0.3100 level. However, the main support is at $0.3000, where buyers are likely to appear.
Looking at the chart, ripple price is showing bearish signs below the $0.3250 and $0.3280 levels. A clear break and close above $0.3300 is needed for a change in trend to bullish in the near term.
Technical Indicators
Hourly MACD – The MACD for XRP/USD might move back in the bullish zone.
Hourly RSI (Relative Strength Index) – The RSI for XRP/USD recovered recently from 25 and it is currently at 40.
Major Support Levels – $0.3130, $0.3100 and $0.3000.
Major Resistance Levels – $0.3250, $0.3280 and $0.3300.


