
Reason to trust
How Our News is Made
Strict editorial policy that focuses on accuracy, relevance, and impartiality
Ad discliamer
Morbi pretium leo et nisl aliquam mollis. Quisque arcu lorem, ultricies quis pellentesque nec, ullamcorper eu odio.
- Bitcoin price climbed further higher and broke the $5,400 resistance level against the US Dollar.
- The price traded to a new multi-month high at $5,461 before correcting lower sharply.
- This week’s followed important ascending channel was breached with support at $5,240 on the hourly chart of the BTC/USD pair (data feed from Kraken).
- The pair settled below $5,240 and it may extend the current decline towards $5,070 or $4,960.
Bitcoin price traded to a new yearly high and recently corrected lower against the US Dollar. BTC dipped below the $5,240 support and it could test the $5,000 support before a fresh increase.
Bitcoin Price Analysis
Yesterday, we discussed the chances of a spike above the $5,400 level in bitcoin price against the US Dollar. The BTC/USD pair did move higher, broke the $5,400 level, and traded to a new yearly high. There was even a break above the $5,450 level and a high was formed at $5,461. Later, there was a sharp bearish reaction and the price declined below the $5,380, $5,320 and $5,280 support levels.
There was a break below the 50% Fib retracement level of the last wave from the $5,151 low to $5,461 high. Besides, this week’s followed important ascending channel was breached with support at $5,240 on the hourly chart of the BTC/USD pair. The pair even broke the $5,200 support and the 100 hourly simple moving average. Finally, there was a break below the 76.4% Fib retracement level of the last wave from the $5,151 low to $5,461 high. The price retested the last swing low near $5,150 and it is currently recovering higher.
However, the broken support near $5,240 and the 100 hourly SMA are acting as resistance. If sellers remain in action, there are chances of more downsides below the $5,151 swing low. The next support is near the $5,075 level. It coincides with the 1.236 Fib extension Fib retracement level of the last wave from the $5,151 low to $5,461 high. Any further declines might even push the price below the $5,000 support area. The next main support is at $4,960 level, where buyers are likely to take a stand.
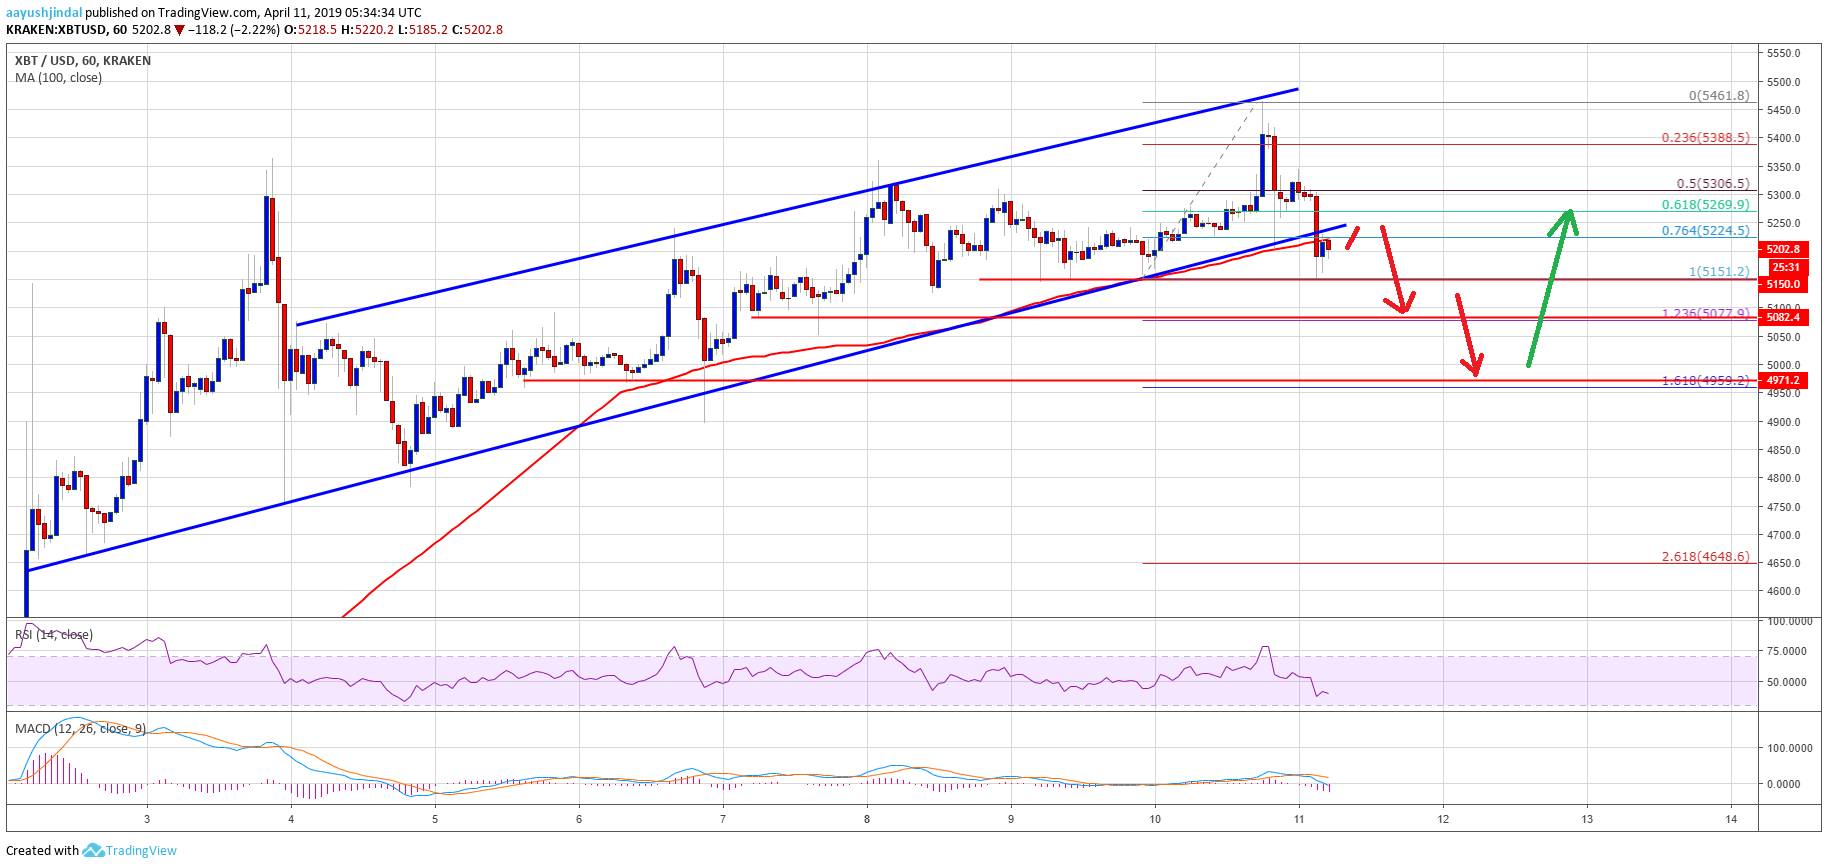
Looking at the chart, bitcoin price clearly moved into a short term bearish zone below $5,240. Therefore, there is a risk of more losses towards the $5,075 or $5,000 levels before the price could bounce back. On the upside, a close above $5,280 and the 100 hourly SMA is must for a fresh increase.
Technical indicators:
Hourly MACD – The MACD is gaining pace in the bearish zone.
Hourly RSI (Relative Strength Index) – The RSI for BTC/USD declined sharply below the 50 level, with a bearish angle.
Major Support Levels – $5,150 followed by $5,075.
Major Resistance Levels – $5,240, $5,280 and $5,320.


