
Reason to trust
How Our News is Made
Strict editorial policy that focuses on accuracy, relevance, and impartiality
Ad discliamer
Morbi pretium leo et nisl aliquam mollis. Quisque arcu lorem, ultricies quis pellentesque nec, ullamcorper eu odio.
- ETH price dipped once again and tested the key $139 support area against the US Dollar.
- The price is moving higher, but it must break the $142 and $143 resistance levels for more gains.
- There is a major bearish trend line in place with resistance at $142 on the hourly chart of ETH/USD (data feed via Kraken).
- The pair might trade in a range for some time, but sooner or later it is likely to revisit $145.
Ethereum price is currently consolidating in a range against the US Dollar and bitcoin. ETH remains well bid on the downside and it could resume its upside above $142 and $144.
Ethereum Price Analysis
Recently, we saw a sharp dip below the $140 level in ETH price against the US Dollar. However, the ETH/USD pair found a strong support near the $139 level and later it bounced back. It settled above the $140 level and the 100 hourly simple moving average. Buyers pushed the price above the $142 level and the 50% Fib retracement level of the last slide from the $146 swing high to $139 swing low. However, the last wave was capped by the $143 resistance level.
Besides, the 61.8% Fib retracement level of the last slide from the $146 swing high to $139 swing low acted as a strong resistance. There is also a major bearish trend line in place with resistance at $142 on the hourly chart of ETH/USD. The pair dipped again recently and retested the $139 support. However, sellers failed to gain momentum below $139. The price is currently moving higher towards the $142 resistance and the same trend line. A successful close above the trend line, followed by an increase in momentum above $143 is needed for more upsides.
The next key resistance is near the $145 level and the last swing high. If buyers gain momentum, there could be a break above the $146 level and the price could rally towards $150. On the downside, an initial support is near the $140 level and the 100 hourly simple moving average. The main support is $139, below which the price may turn bearish in the short term.
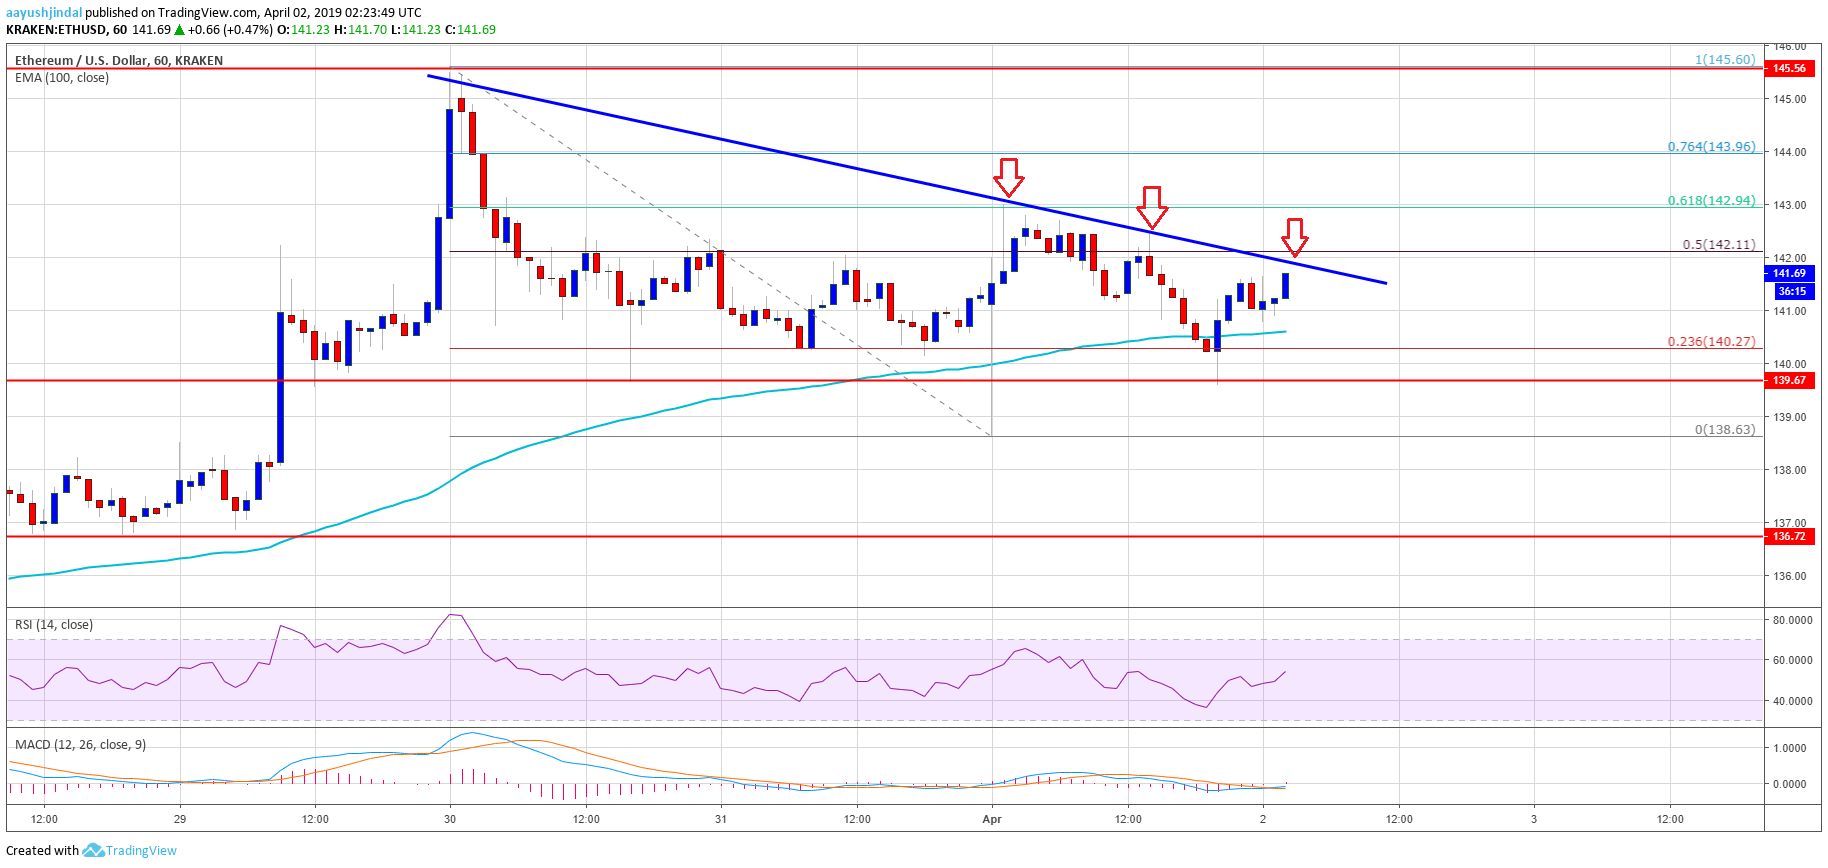
Looking at the chart, Ethereum price seems to be struggling to gain pace above $142 and $143. Once buyers succeed in clearing the mentioned hurdles, there could be a fresh increase above $145 and $146 in the coming sessions.
ETH Technical Indicators
Hourly MACD – The MACD for ETH/USD is about to move back in the bullish zone, with a positive bias.
Hourly RSI – The RSI for ETH/USD is currently moving higher, with a positive angle above the 50 level.
Major Support Level – $140
Major Resistance Level – $143


